Market Risk is on the Rise.
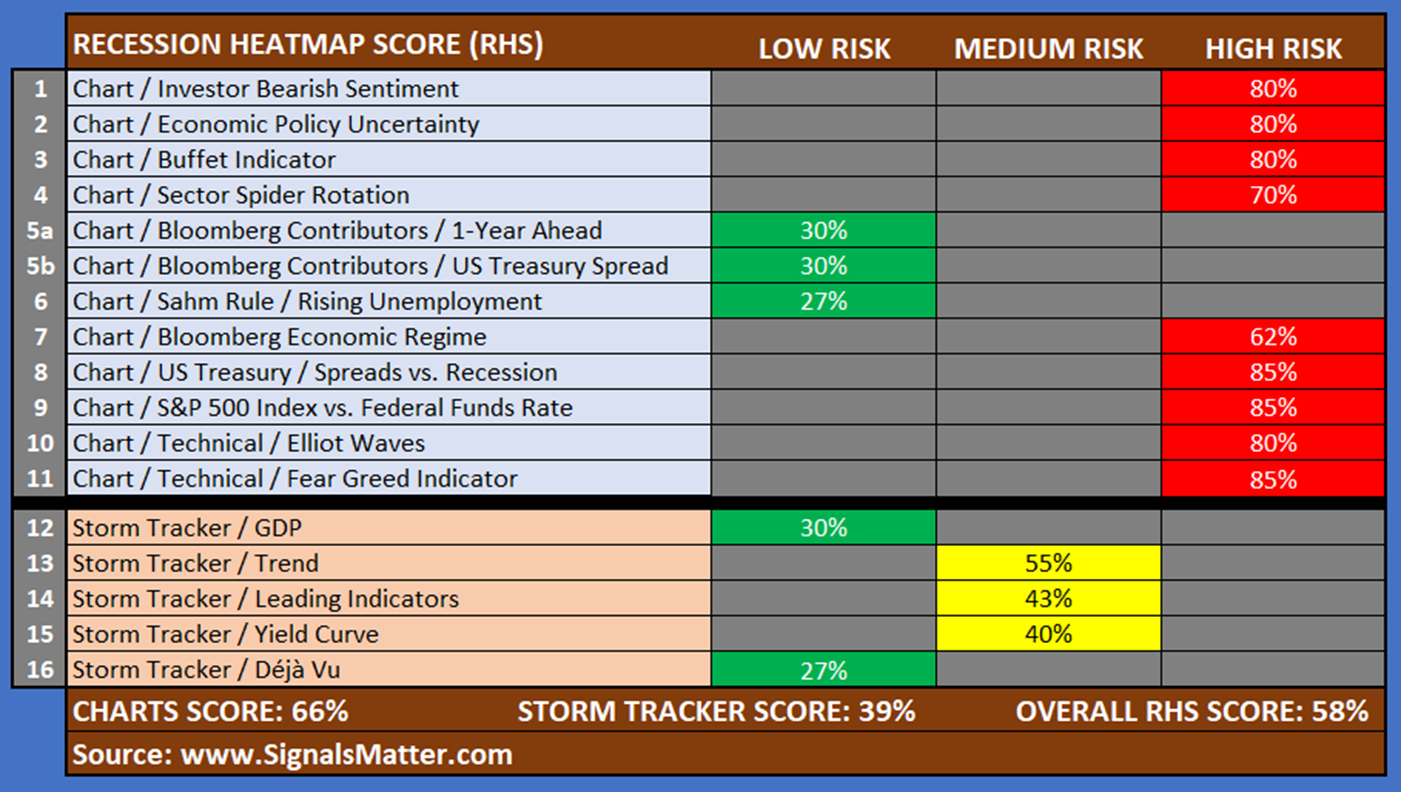
When we published Version 1.0 of our series, “Party-On or Hunker Down,” on October 17, 2024, our Recession Heatmap Score (RHS) indicated a low 33% probability of a recession, suggesting a “party on” atmosphere. In Version 2.0, released on December 17, 2024, the score rose to 36%, which is still tolerable for risk-on investing.
Yet as 2024 transitioned into 2025, our RHS surged to 55% in Version 3.0, published on March 6, 2025, and has reached 58% in Version 4.0, this April 15, 2025. Charts-only scores indicate an even higher probability, showing a 66% chance of a recession.
In simplest terms, market risk has significantly increased over the past two months, with RHS scores reflecting a clear shift to a “hunker down” mode.
Follow the Yellow-Brick Road
The “Yellow Brick Road” is a well-known metaphor that comes from The Wizard of Oz, a classic book by L. Frank Baum, as well as its iconic film adaptation. In the story, it fantasies the golden path that Dorothy and her companions follow to reach the Emerald City, where they seek solutions to their problems.
In the realm of investing, the “Yellow Brick Road” symbolizes a strategic route to financial success by following a clear and disciplined investment strategy that guides investors toward their goals, much like Dorothy’s journey to the Emerald City.
Here at Signals Matter, we provide charts, graphs, and insights to assist individuals in making informed investment decisions. Our well-researched and structured approach to portfolio construction is akin to staying on the “Yellow Brick Road” when it comes to portfolio construction and management.
Our “Yellow Brick Road” includes a myriad of components that inform on our Recession Heatmap Scores. Here are a few examples.
Tracking Federal Funds Rates
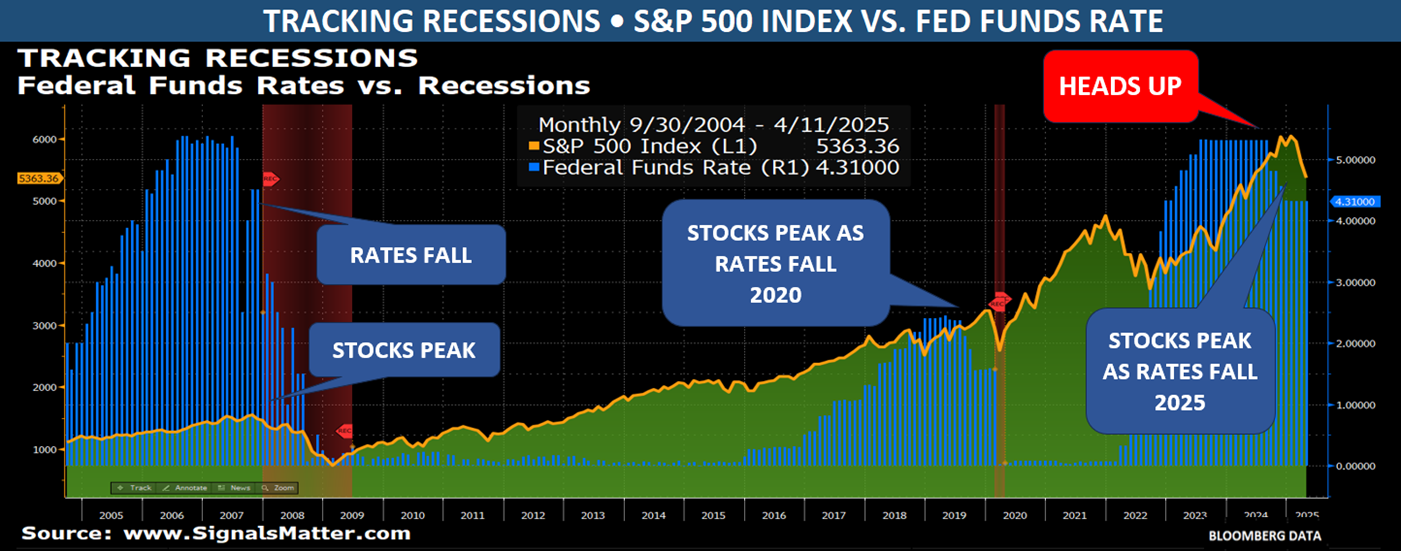
The Federal Funds Rate is the interest rate at which banks and credit unions lend and borrow funds from one another on an overnight basis. While this rate is primarily determined by the market, it is influenced by the Federal Reserve through open market operations. The Federal Open Market Committee (FOMC) sets a target range for the Federal Funds Rate to help control inflation and manage economic growth.
A significant discrepancy between the S&P 500 Index and the Federal Funds Rate may signal a potential recession, charted below. When the Federal Funds Rate decreases and the gap between it and the stock market widens, it could indicate that stocks have reached their peak and are beginning to decline.
Currently, this spread is continuing to tighten, suggesting a more bearish outlook.
Sector Spiders
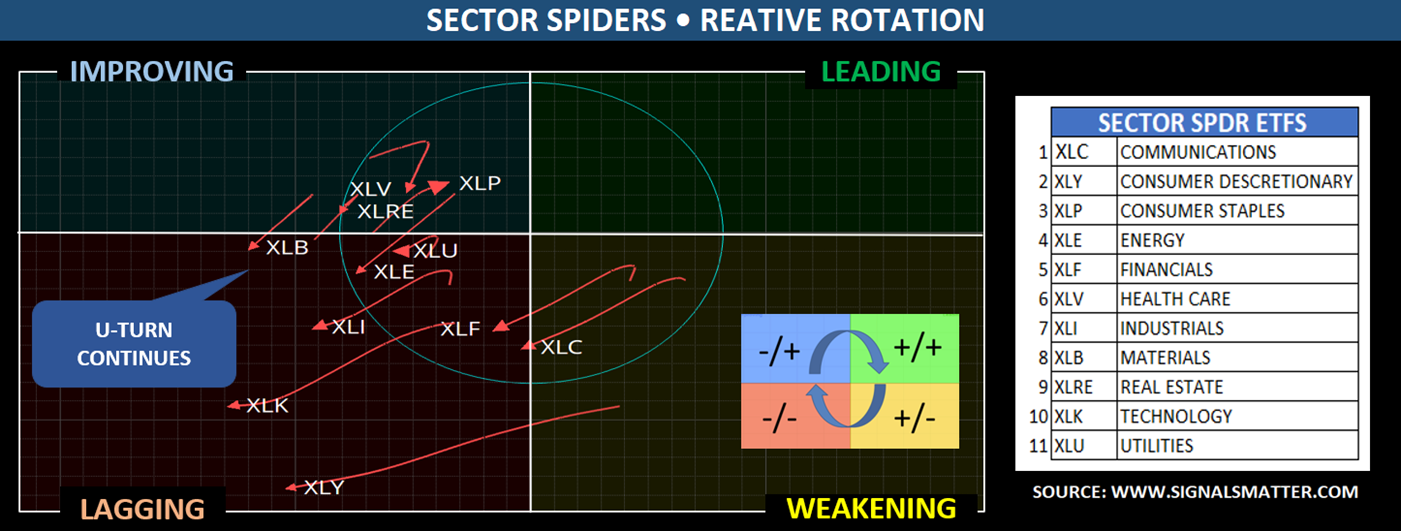
Sector SPDRs (Standard & Poor’s Depository Receipts) are a type of exchange-traded fund that separates the S&P 500 into sector-specific index funds. Each SPDR ETF tracks a particular sector of the economy, allowing investors to focus on specific segments of the market, including communication services, consumer discretionary, consumer staples, energy, financials, health care, industrials, materials, real estate, technology, and utilities.
Recently, Sector SPDRs have been facing challenges. Most are underperforming, and those that had shown improvement have experienced a notable decline.
Tracking Fear vs. Greed
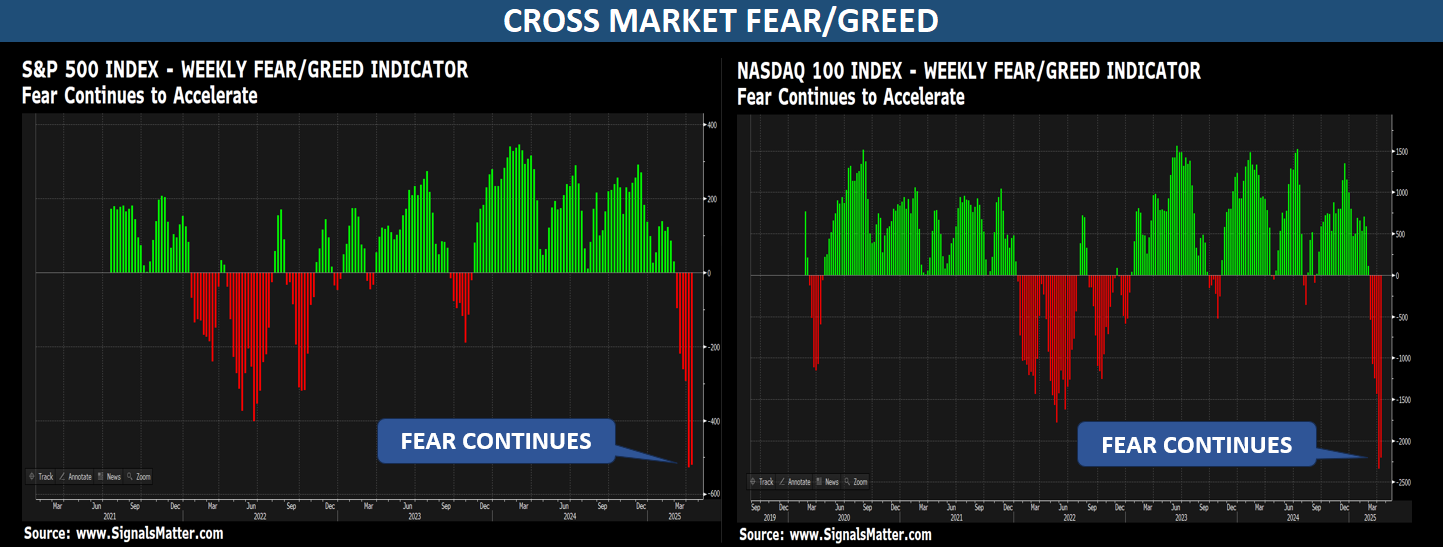
The Fear/Greed Index is a market sentiment indicator developed by CNN Business to measure investor sentiment in the stock market. The index ranges from 0, which indicates Extreme Fear, to 100, which indicates Extreme Greed.
The primary goal of this index is to evaluate how emotions such as fear and greed influence stock prices. It is based on seven key indicators: stock price momentum, stock price strength, stock price breadth, put and call options, market volatility, demand for safe havens, and demand for junk bonds.
Note that greed has shifted to fear for four consecutive weeks in both the S&P 500 and Nasdaq-100, with a confirming low recorded last week.
Portfolio Construction
There are two sides to every coin: “heads” (you win) and “tails” (you lose). However, it doesn’t have to be that way for investors willing to adopt both “long” and “short” strategies.
When you invest “long,” you buy an asset (like a stock) with the expectation that its value will increase over time. You profit by selling it at a higher price than what you paid. For example, if you buy shares of a company believing its stock price will rise, you’re taking a long position.
When you invest “short,” you bet that the value of an asset will decrease. In this case, you borrow the asset (usually through a broker) and sell it at the current price. Later, you buy it back at a lower price to return it to the lender, keeping the difference as profit.
We use Inverse Exchange Traded Funds (Inverse ETFs) to simplify shorting. Inverse ETFs are designed to profit from a decline in the value of an underlying index or asset by using derivatives, such as futures contracts, to move in the opposite direction of the benchmark they track.
By investing both long and short, investors can benefit from both sides of the market. “Heads” (you win) and “tails” (you win), which is what we strive to do here at Signals Matter for our website Subscribers and hedge fund Investors.
In the following example, ETFs in the improving quadrant are underperforming but gaining momentum, while those in the leading quadrant are outperforming with strong momentum.
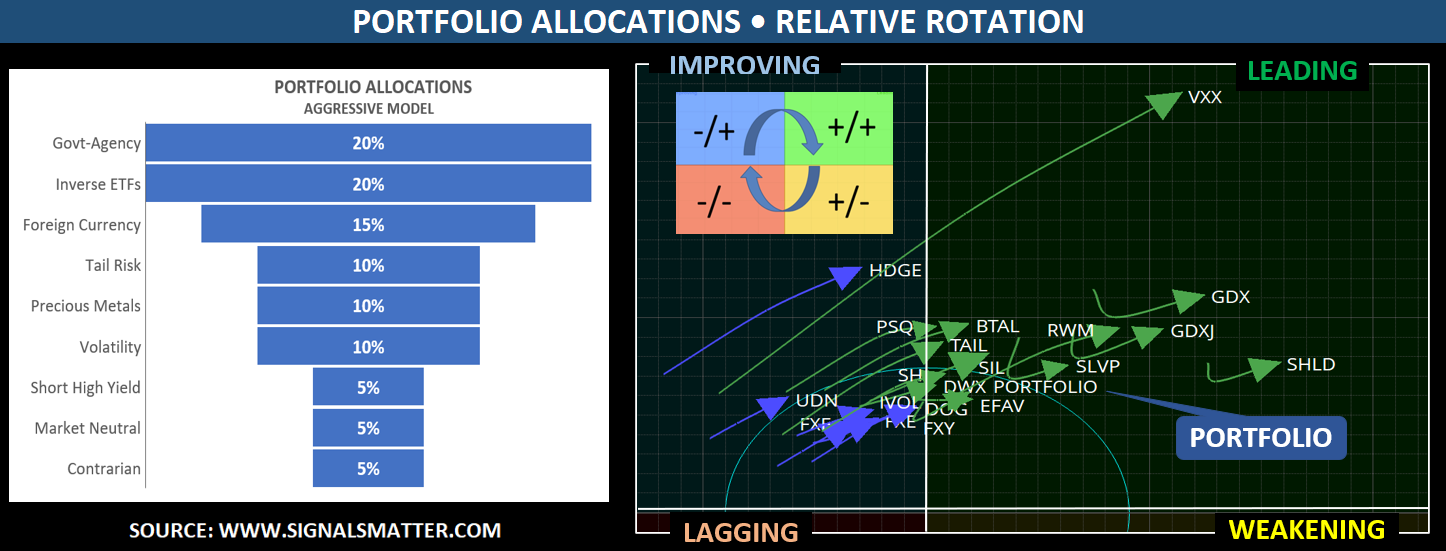
As we draft this Market Report, we are 31% net short across our ETF positions, allowing investors to profit even as stock prices tumble. Therefore, both “long” and “short” ETFs are currently positioned in the “Improving” and “Leading” sectors from a relative rotation perspective.
Our goal is to make money in all investment environments, whether bullish or bearish.
In Summary
The main takeaway from our analysis is that there is currently a 55% risk of a recession occurring within the next 12 months, a significant increase from 36% reported last December.
Our subscribers monitor updated signals and charts daily, a service that is available for just $97 per month, totaling $1,164 annually. The fee represents only 1.2% of a $100,000 portfolio. Portfolio valuation can fluctuate by 1-2% in a single day!
Additionally, whether a Subscriber or not, investors that are Accredited Investors are invited to automate their investing process by allocating funds to our hedge fund, Signals Matter Partners LP, which we launched last year. For more information, please visit Signals Matter Advisors.
As a last tip: Take note that recession indicators usually emerge just one to three months before action needs to be taken, making this a most opportune time to connect with Signals Matter.
Join or Meet Us
Signals Matter Market Reports reflect the company’s long-term macro views and are posted free of charge at www.SignalsMatter.com, on LinkedIn, and directly to your inbox by Signing Up Here. Portfolio Solutions are geared to shorter timeframes and may differ from our longer-term perspectives. Our actively managed Portfolios are available to Subscribers who Join Here and to Accredited Investors who directly invest in Signals Matter Partners, LP. For further information, click Direct Invest or Book a Meeting with us.