Our Market Insights
Market Insights are the Crux of Smart Investing
Valuable in-depth information is foundational to smart investing. So is knowing what’s valuable and what’s not. That’s why we go the extra mile at Signals Matter to educate and inform on what we do and how we do it, so you can learn how to build portfolios yourself, or just trust us to leave the driving to us. We share it all, our Market Insights, Daily Insights, and Macro Insights.
Sector Rotation
Sector Rotation Matters
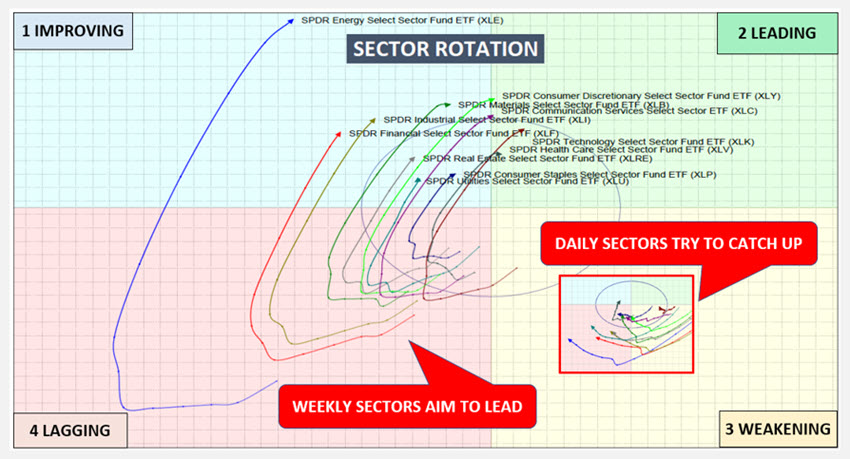
Sector Rotation is a useful tool when it comes to looking ahead, rather than behind. Past performance is never an indicator of future returns. Sectors reliably rotate and provide Subscribers a heads up when sectors are over-bought (so they can sell) or over-sold (so they can buy). Mapping both weekly and daily sector rotations together provides money-making clues, sector by sector.
Sector Performance
Sector Performance Validates
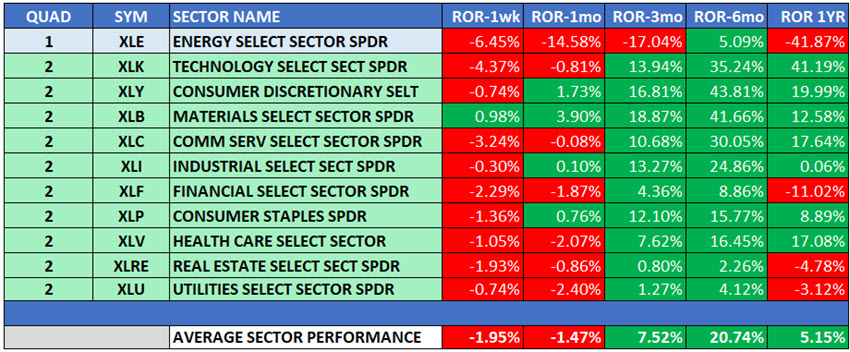
Sector performance typically validates Sector Rotation. When it does, the trend is all the more compelling. When it doesn't, we tell you why and how to interpret. Sector Rotations alone can be a valuable investment tool.
Money Flows
Money Flows Lead Price Changes
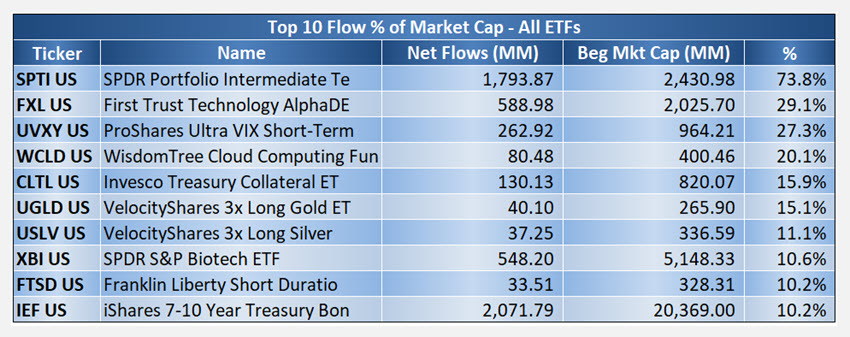
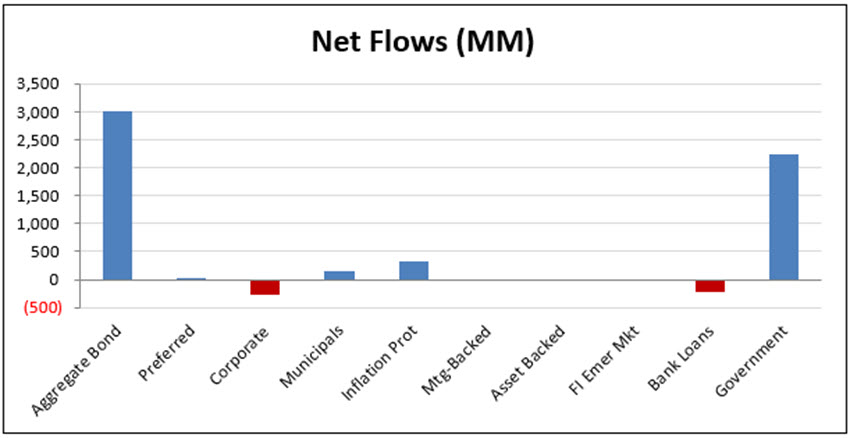
Money talks, in the form of funds flowing into or out of Exchange Traded Funds (ETFs), and when the money talks, it’s literally worth listening. We track flows for thousands of ETFs across general markets and individual sectors, so we know where the big boys are moving, providing Subscribers a distinctive edge when it comes to being on the right side of the markets. Flows matter. Take advantage.

Storm Tracker
Storm Tracker Maps Risk
Storm Tracker is your 1-stop shop that tracks choppy waters ahead. It measures the probability of upcoming stormy weather by tracking literally hundreds of indicators, from GDP to global trends to up-to-date leading indicators to yield curves and our market timing indicator, Déjà Vu. Storm Tracker is updated weekly and informs on portfolio cash positioning.
Start Protecting Your Portfolio Now
Read up on how Storm Tracker protects your portfolio, what's included and why. Storm Tracker calculates the odds of Stormy Weather, then informs Our Portfolio of just how much cash to hold aside. Subscribers call Storm Tracker a life-saver. It is literally that, intended to keep you afloat during periods of heightened or extreme risk.
Daily Insights
New Insights Are Posted Each Day | Two Recent Examples
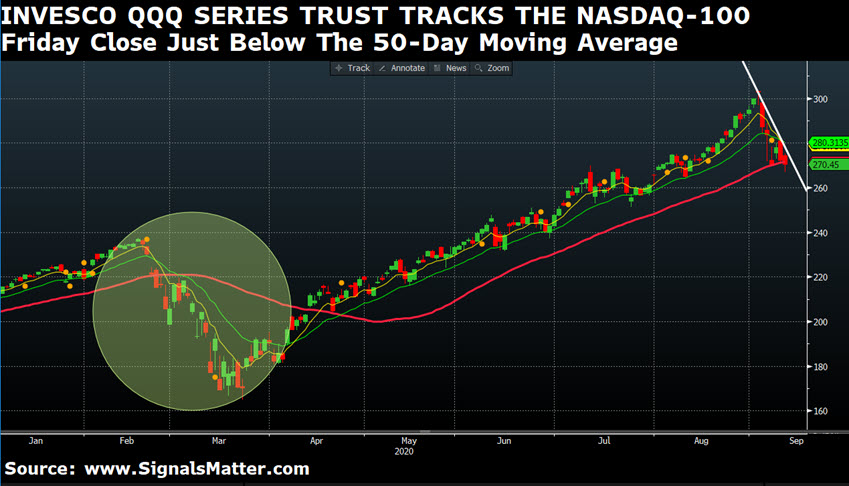
QQQ Closes Below Its 50-Day Moving Average
In a continuing story, the Nadaq-100 closed below its institutional 50-day moving average on Friday, as expected, technically placing the bears' odds in favor. Here are some high-flying stocks that also closed below the 50-day: Microsoft (MSFT), Netflix (NFLX), Amazon (AMZN), and Google (GOOGL). The bulls didn't buy the dips last week, as net sellers prevailed, suggesting weakness ahead. The Russell-2000 also closed below its 50-day moving average. Accordingly, we have added ProShares Short Russell 2000 (RWM) to our list of portfolio suggestions for the coming week.
Realistic?
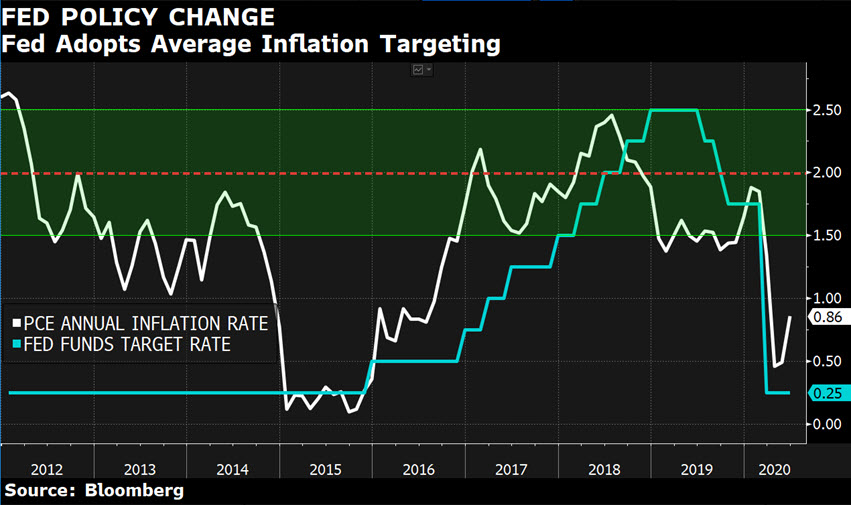
Following the Fed’s September FOMC meeting this mid-week, no new policy action is expected following the adoption last month of the Fed’s new average inflation targeting framework. A glance at the chart below gives little credence in our book that inflation is going anywhere anytime soon. Continued delays in further stimulus and inadequate aid packages, muddied by politics, seem likely to get in the way. Note the high correlation between inflation rates and the Fed target interest rates since 2015. When inflation does rise, those low rates will rise as well, if for no other reason than to lower them all over again when the next recession hits. As rates rise, bonds and stocks could together be adversely impacted, a nightmare for those 60/40 pie chart portfolios.
Our Global Heatmap
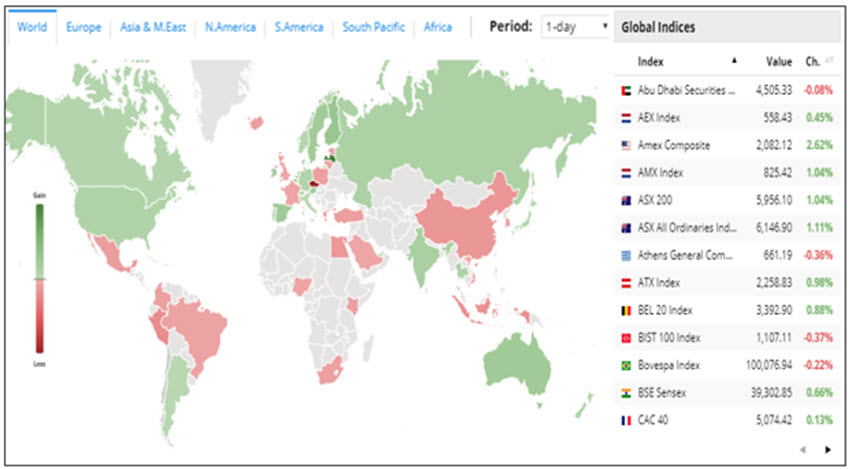
Global Heat Maps Inform
The Global Heat Map displays equity stocks performances, in whatever country and timeframe you choose. Counties displayed in red are losing money today. Those in green are making money. Grey is ambivalent. Dig deeper by clicking on any country. Then click to the right on any specific country-index you wish to chart and explore.
Our Market Watch
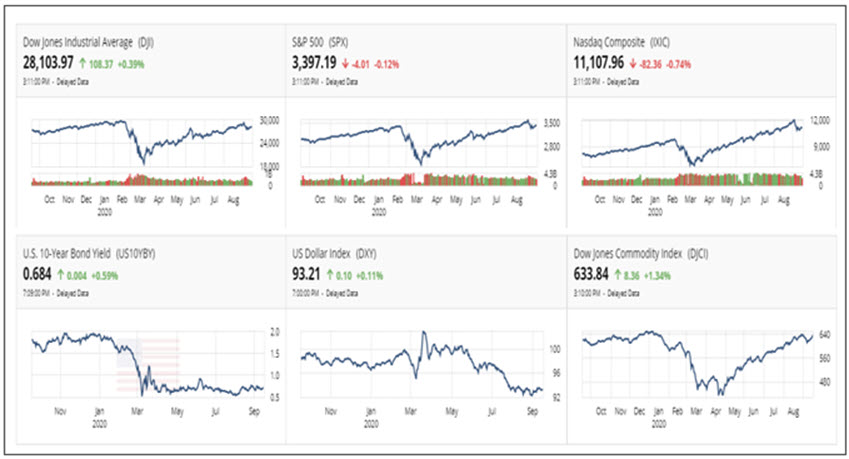
Market Watch Informs
Market Watch displays current performance for US-based stock, bond, US dollar and commodity indexes. Be your own analyst. Click on any index for a full-screen chart. Then add nearly 30 overlays and indicators to analyze momentum, trend, and more. And click on associated news feeds.
Macro Insights
Our Blogs, Market Reports & Podcasts
Our library of blogs, Market Reports, and podcasts include literally thousands of pages of industry-leading commentary on bonds, central banks, foreign markets, macro, real estate, stocks, and so much more. Sometimes entertaining, sometimes just plain frank, yet always informing, our reports cut through the Wall Street glaze and give you straight-talk when it comes to what you need to know to invest wisely.
Recent Market Insights
Market Question: Party On or Hunker Down?
THE SORTINO RATIO MATTERS
Rotate & Invest Toward Absolute Returns
The Signals Matter Market School
Study Up on the Markets and Learn How to Invest
That is why we've created The Market School, a safe, user-friendly and evolving online market education tool for Signals Matter Subscribers Only (novice to expert) that seeks to cut through the noise of Wall Street talking heads and sell-side pitches to get to some straight-talk.


