Market data can be such a stubborn thing…
Supporting Bewilderment with Market Data
I’ve been fairly cynical of late…So, let’s get back to what we do best: Blunt market data and signals which add both math and perspective to our cynicism.
In today’s Market Report, we highlight the distance between market data and fiction when it comes to market valuations and, alas, your portfolio.
In recent Market Reports here, here and here, we have shared at length our view that the Fed’s bazooka of unlimited liquidity and asset purchase programs, collectively worth north of $5 trillion thus far, may not save the day, or your portfolio.
This is not to create drama; it’s just about respecting critical market data. Nothing more.
The data that reflects all the bad economic news we’ve been sharing is about to hit Wall Street’s front page.
And it will be disruptive, to say the least. Yet stocks have recently rallied on “accommodation” from DC, down just 18% from their late-February highs.
Can (or should) you take the Fed’s pledge to “do whatever it takes” to the bank?
Will zero-bound interest rates save the day, given they were already near the zero-zone stepping into Covid-19?
Well, let’s consider the market data to better inform such a decision.
What a Difference a Week Makes
If you hadn’t noticed last week, quite a few credible folks have gone to the dark side when it comes to GDP forecasting, worsening their bearish market forecasts by 2x and more.
In other words, our research and conclusions are by no means (and no longer…) un-shared.
In just one week, Bloomberg’s U.S. Forecast shifted seriously to the negative side, on well…you name it…GDP projections, soaring unemployment rates, deflating/inflation dynamics and an increasingly impotent Fed Funds Rates, now pinned to (and below) the floor.

Let’s talk about each one of these indicators and a few more, for a total of the seven indicators you need to track (as we do every day for our subscribers here at www.SignalsMatter.com).
Buckle up…this is another chart-heavy and cold reality-check.
1 – GDP
For starters, nearly 100 Bloomberg contributors (consisting of leading banks, universities and well-known economic forecasters) flipped their odds deeply to the recessionary side last week.
The Bloomberg Contributor Composite we last posted for Signals Matter Subscribers has slipped even more.
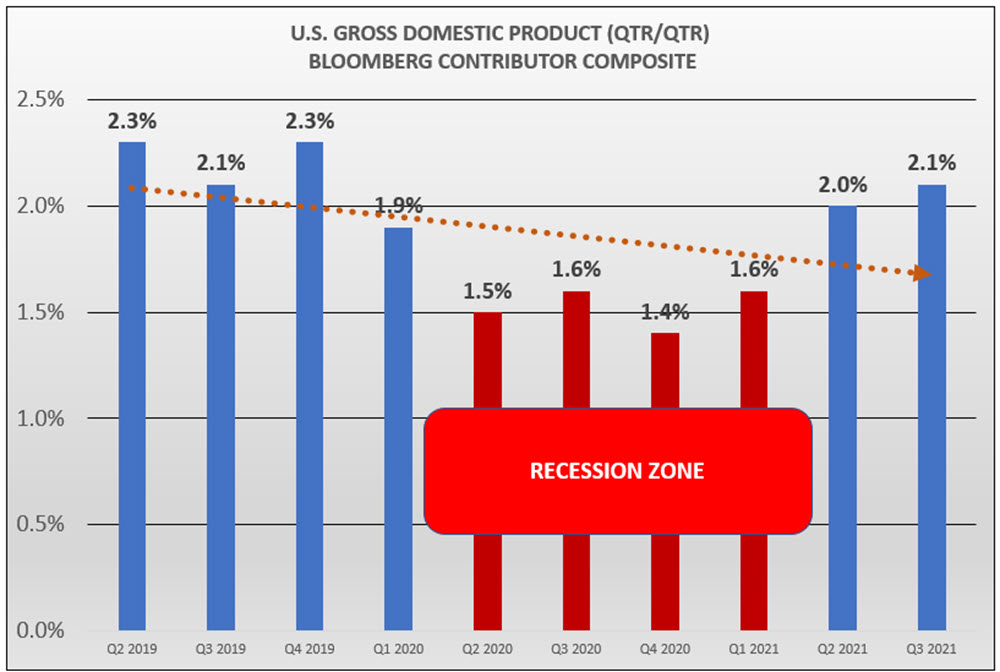
Here’s the forecast we posted last Monday, showing GDP forecasts tumbling to 1.4-1.6% for the four quarters beginning in this Q2 2020.
We labeled this the “Recession Zone,” confident as we were that the estimate would go recessionary with the passage of time.
Signals Matter Subscriber Content | Click Here to Sign Up
It only took a week to get much, much worse–i.e. from a recessionary red zone of 1.6%… to revised GDP number of NEGATIVE 4.8% GDP to come.

Signals Matter Subscriber Content | Click Here to Sign Up
Today, we thus posted a Subscriber update on this chart (among many more) that takes Q2 2020 GDP forecasts from +1.5% to negative -4.8%.
Read that again. Now that’s a helluva downgrade, in just a week.
Consider this as well: Do any of you actually think we are really going to bounce back to even levels of GDP (or new GDP highs of 5% from a negative 4.8% forecast) over the next four quarters as the above Bloomberg plot suggests?
That is, do any of you actually think that four quarters out from this clearly horrific Q2, 2020, are we going to miraculously jump to +5% GDP as if there will be no lasting effects at all from the absolute gut-kick the global shutdown has delivered to an already debt-ravaged and objectively rigged-to-fail global economy?
Just think really hard and honestly about that. Be your own guide.
So far, many true believers in the stock market are betting that the steady red-dot trendline in the chart above will safely carry GDP over the abyss.
Do you? That’s the question you need to ask yourself.
Below, we offer some market data to help you decide for yourselves. As for us, we are not making such a bet. Why?
As Nassim Taleb would remind us, a system already made so fragile by over a decade of staggering debt-driven “growth” (i.e. “cancer”) cannot simply V-shape “recover” unless the central banks ostensibly print trillions more and just simply put the entire economy on a credit card.
And if you think that makes sense, I have a lemonade stand in Siberia to sell you.
Folks, there is risk, which can be measured by market data, and there is uncertainty, which cannot be measured at all.
Knowing the difference between risk and uncertainty is absolutely critical today.
COVID-19 and the domino-effect of uncertainties ahead simply creates too much uncertainty to be taking too much risk in (or giving too much faith to) these Fed supported markets.
What we have today are objectively horrible market data fundamentals on the one side, and a Fed and debt-driven Bazooka on the other side. Which side will overtake the other?
Well, let’s consider more market data…
2 – Unemployment
A total of 6.61 million Americans filed for unemployment benefits in the week ending on April 4, according to a Labor Department report released last Thursday, which brings the three-week total of recorded unemployed to more than 16.8 million as the Coronavirus outbreak shut businesses down across the country.

In short, we’re now looking at unprecedented layoffs which exceed the Great Recession of 2009 by 10-fold.

3 – Inflation/Deflation
Meanwhile, U.S. headline inflation is projected to fall sharply, into negative territory this Q2 2020, down to -1.5%. That’s, this quarter, as the coronavirus (along with a Saudi-Russian oil game of chicken) has helped push down fuel and other input costs.
The Consumer Price Index (CPI) is expected to recede to levels not seen since the Great Recession. Energy prices have dropped by the most in five years, reflecting one of the sharpest collapses in oil ever.

When it comes to commodities, these have been entrenched in a deflationary mode since the Fed-induced rate manipulations post-2008, and are now taking into account the continuing impact of Covid-19.
Here’s what’s currently clear in the chart below. Equities have a long way to go toward the downside to match recession-corrected bottoms.
Covid-19 is accelerating deflationary trends. Which is why we repeat what we’ve said before about the market bottom, namely: We are not even close to the bottom yet.

4 – Interest Rates
As to the Fed Funds Rate and interest rates generally, they have plummeted with the Fed taking interest rates to the zero-bound, with negative rates here in the U.S. now in store. Never a good sign…
According to hedge fund manager Ray Dalio, “Hitting this 0% floor also means that virtually all the reserve country central banks’ interest rate stimulation tools (including cutting them and yield curve guidance) won’t work.”
Needless to say, we’ve been warning of this for a long time.

Signals Matter Subscriber Content | Click Here to Sign Up
Note this as well…those long rates in the chart above are beginning to tick back up, which is like a shark fin rising above the surface and racing toward the bond market. And remember this: The bond market is everything.
The arrival of this rising-rate shark fin makes sense and is easily trackable, as we did in October of 2018…
This is because the only way to finance this bazooka of stimulus is by the U.S. Treasury Department issuing trillions of new debt supply (i.e. Treasury bonds) into the marketplace, which pushes bond prices down and hence yields/rates slowly up—again, like an ominous shark fin.
Meanwhile, those new bonds are immediately being bought by the Fed with fiat (i.e. printed dollars), but (hopefully) by others too, in a desperate race to buy (i.e. create artificial demand for) those bonds and keep their shark-fin yields/rates down rather than rising. (Remember: Bond prices moves inversely to bond yields.)
But here’s the irony: Rising yields and rates make our debt burdens impossible to repay, yet at the same time, bond buyers won’t buy these bonds unless their rates and yields rise. Dilemma? You betchya…
Natural (rather than central bank) bond buyers are going to need and demand a higher interest rate and yield to have any appetite at all for Uncle Sam’s IOU’s, especially if Fitch (or any rating agency) dings our country’s credit rating, as they have other countries lately.
But if no one else buys our currently low-yield debt, who will? The Fed, of course. And this, in turn, means even more money printing (QE) ahead. Again, there’s simply no way around this.
But the Fed can only print for so long, and the Treasury Department can only add more debt for so long. The more bonds they issue, the lower the bond prices (basic supply and demand dynamics), and hence the higher the yields and rates.
Such a dynamic would take long rates up, and once they get to, say, 2.7% on the US 10-Year Treasury, that folks would pop the debt bubble.
Remember, recessions are always debt-driven. Déjà vu. Again, we’ve been warning of (and explaining) this over and over and over.
And we’re not alone. Across the Group of Seven, net purchases for G-7 central banks (i.e. QE on steroids) were close to $1.4 trillion in March, just to get started, by itself close to five times higher than the previous Great Recession peak of $270 billion. Read that line again…
That was just in one month, March 2020. Trillions upon trillions more are pledged for this April. Look like a lot to you, comparatively speaking?
Folks, this what pure desperation disguised as “accommodation” looks like:

5 – Financial Conditions
For our paid subscribers, we track (among so many things) Bloomberg’s U.S. Financial Conditions Index in Trend Watch, a component of Storm Tracker, as it is a valuable barometer of financial market health, or in this instance, malaise.
The index is made up of money-market, fixed-income and equity indicators. Positive numbers show that markets are more liquid while negative numbers indicate less liquidity and thus greater stress, for every market crisis, in the end, boils down to a liquidity crisis, which is where the market data is now pointing.
The index is based on today’s standard deviations (volatility) compared to what was normal before the 2008 financial crisis. In October 2008, the index fell to as low as -12.6. We’re now about one-third of the way there, as the 20-day moving average shows the trend is getting worse.
Again, just market data, not opinions.

6 – Unproductive Capacity
Here’s some more market data. Industrial capacity is in a deep slide.
By example, U.S. steelmakers are reaching unproductive capacity levels not seen since 2016. The American Iron and Steel Institute figures show mills running at lower than 69%, as demand wanes amid the Coronavirus lockdown.
That share is well below the 80% threshold needed for the steel industry’s long-term financial health, yet further declines may be in store. Citigroup is forecasting “heavy” pressure on demand in the second and third quarters.
For those looking for a bottom to buy into this sector, be patient: We ain’t there yet…

7 – Real Estate
Some more market data.
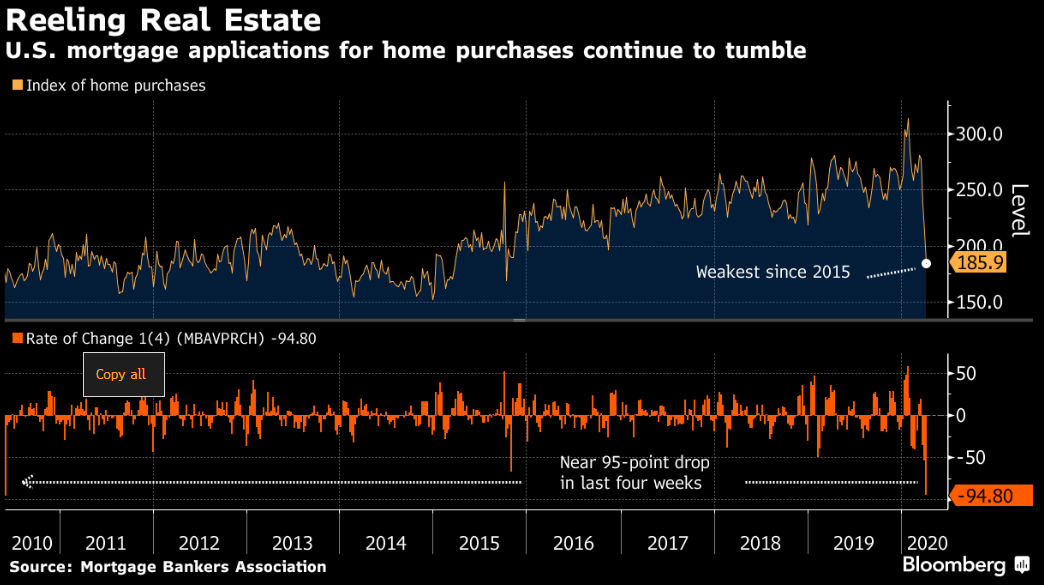
Loan applications to purchase homes in the U.S. declined last week to the lowest levels since October 2015, a fourth straight drop that further underscores the growing economic fallout from Covid-19.
You might be wondering why loan applications are down when rates are so seductively low? It’s simple: Many Americans have no faith in a safe source of income or employment to take on even dirt-cheap mortgage rates.
By example, the Mortgage Bankers Association’s purchase index slumped 12.2% in the period that ended April 3. Over the past four weeks, the indicator has declined nearly 95 points, the sharpest monthly drop since mid-2010.
Summing Up the Market Data: 100% Certainty
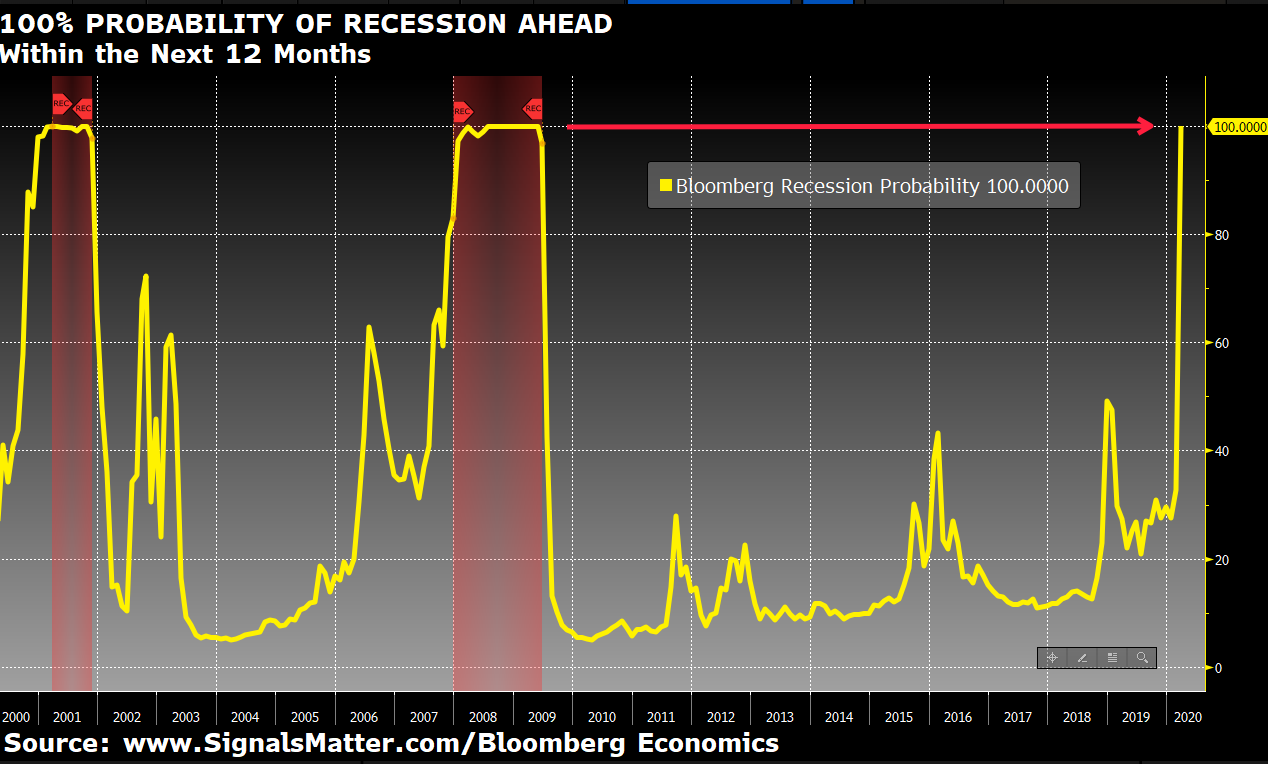
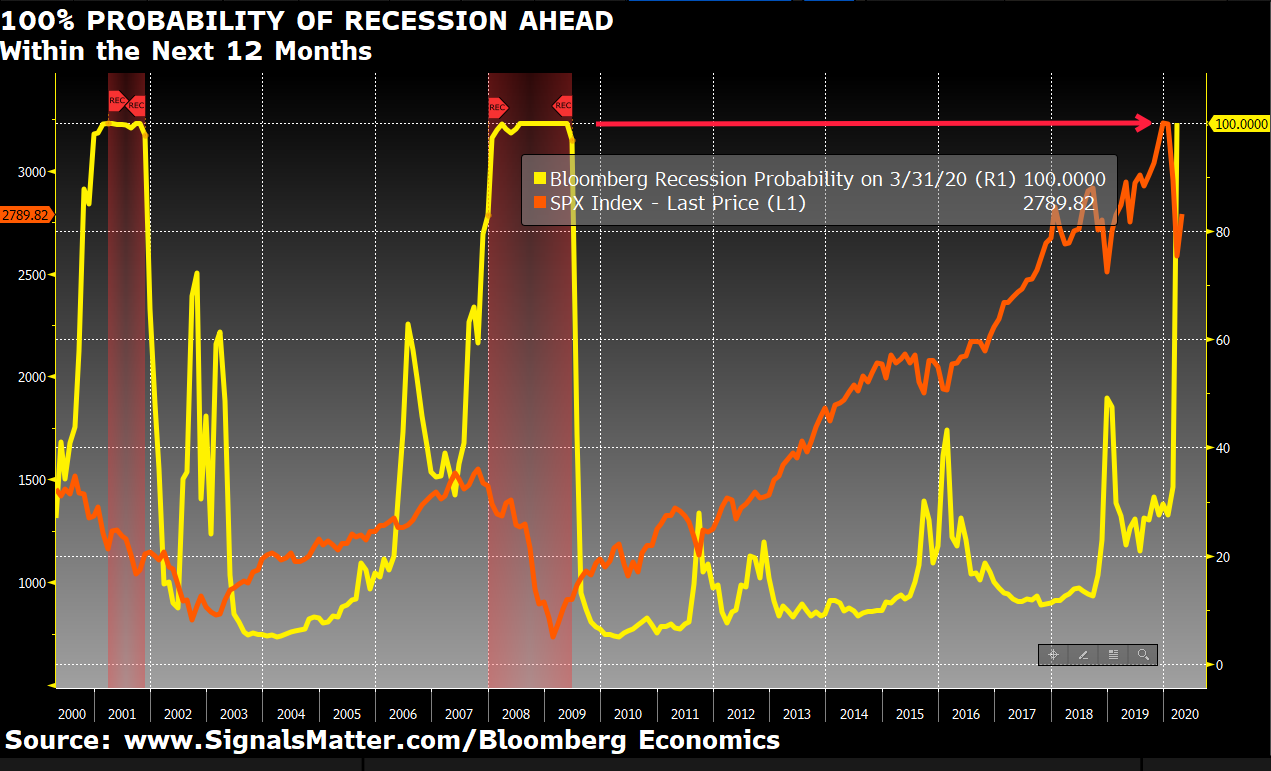
Combined, these seven market data inputs across GDP, unemployment, inflation, zero-bound interest rates, financial conditions, unproductive capacity and real estate were enough for Bloomberg to raise its 2020 U.S. Recession forecast from about 50% to 100%.
Read that again, there’ s a 100% chance that we’re already in a recession, one we called (and prepared for) months ago.
Signals Matter Subscriber Content | Click Here to Sign Up
What’s Next?
Which brings us to the question as to what’s next. With forecasting, there are always things we know and things we don’t know. Again, we track market signals not tarot cards or media pablum.
We know, for example, that the combination of a global drop in GDP, a hard-stop in global trade, fast-falling commodity prices and all the other critical market data we’ve described above, are collectively posing considerable headwinds for an overdue shakeout in stocks.
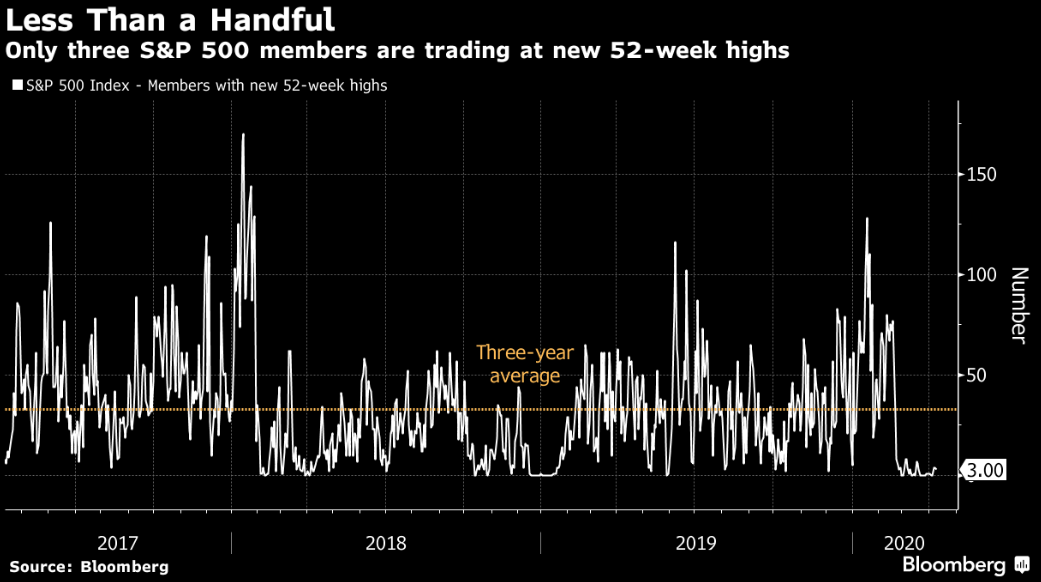
In fact, only three members of the S&P 500 Index are trading at new 52-week highs, well-below recent historical averages, a red flag when it comes to expectations that stocks can stay at these lofty levels, absent underlying real (vs. fake) momentum or just all out nuclear options at the Fed’s unlimited money printing hail Marry.
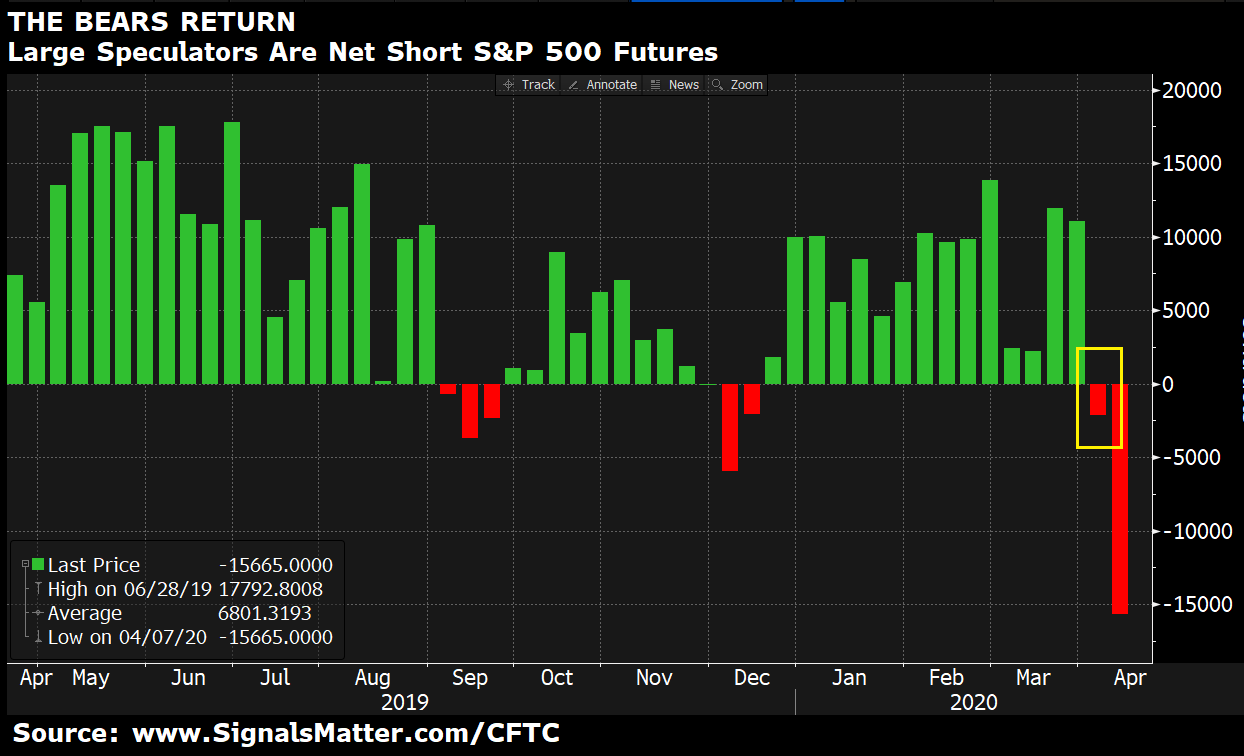
And we know this…according to the Commodity Futures Trading Commission (CFTC), the big boys (i.e. the large institutional traders) are getting seriously net short stocks (i.e. betting against stock prices) in the futures markets.
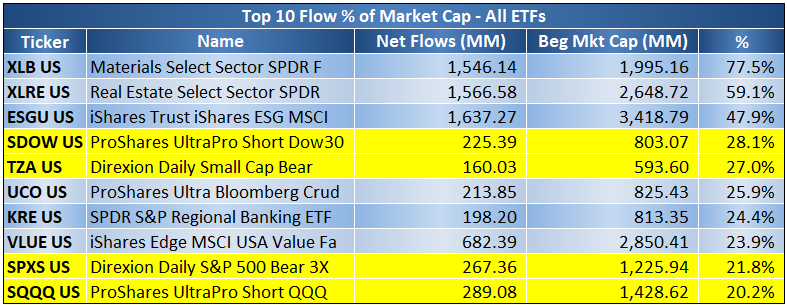
Furthermore, market data regarding less fancy, plain old retail investing trends/flows ought to raise a common sense eyebrow. Last week, flows into ETFs that short (bet against) stocks hit the top-10 list.
Signals Matter Subscriber Content | Click Here to Sign Up
Day of Reckoning | Not Yet Resolved
We’ll leave you with this last chart of market data…Bloomberg’s recessionary call with an S&P 500 Index overlay.
Signals Matter Subscriber Content | Click Here to Sign Up
You be the judge. We are just giving you the evidence and FACTS. The rest is fairly easy for what we call a “summary judgement” in law school…
In the past two recessions, when the Bloomberg Recession Indicator hit 100%, stocks plunged.
Different this time? Will the barrage of Fed liquidity (i.e. country-destroying yet can-kicking MMT) serve to suppress an economic day reckoning?
In short: Can the Fed save your portfolio? For that’s what this has now boiled down to: Horrific market data on the one side, and massive Fed and DC debt and money printing on the other.
Are you prepared to place your portfolio entirely in the hands of a Fed slowly running out of both ammo and credibility?
It may help to think of it this way…the Fed has bought the markets.
We said they would, and now it’s official. Virus or no virus, the Fed literally had (and has) NO choice but to print obscene amounts of money to “support” a debt-ravaged corporate and government debt market/bubble.
So, if you’re still fully invested, you have a new money partner now, and they’ve got more money and power than you do—namely, the U.S. Federal Reserve. If they run out of money, they can print more. If you run out, you can’t.
But just to remind, the Fed has 0 in 9 record for “saving” its partners. If you want to place all your chips with them, well…that’s your call.
We won’t, and nor will our informed subscribers. We’ve got a better plan for them, one based upon market data rather than Fed speak or Fed desperation.
Portfolio Solutions
Here at Signals Matter, we react by taking an active approach to Portfolio Management, in these times and in all times, recently described at length here.
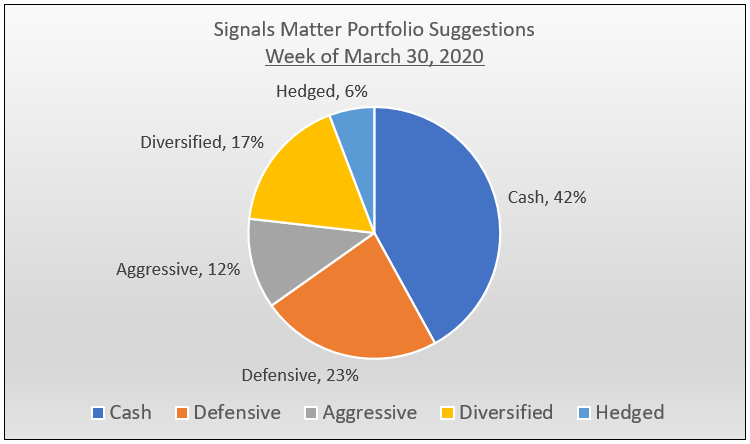
Recently suggested allocations appear below, by risk category so as not to disclose positions, but these have changed for the current week of April 13 with all that is happening, as has so much of our weekly narrative and virtually all of the charts we post for Subscribers at www.SignalsMatter.com.
To see the changes we have made, including the individual instruments we are now suggesting, please click here.
Signals Matter Subscriber Content | Click Here to Sign Up
Until our next post this Wednesday, stay informed, protect your portfolio from what you don’t know, stay safe and stay indoors as much as you can.
We know it’s never wise to fully “fight the Fed,” but it would be equally, if not more, unwise to place all your trust (and money) in them as well. Your choice, but you know where we stand.
Your Guides, Matt & Tom


Matt/Tom,
Here it is, Rigged to Fail….
https://www.zerohedge.com/markets/investing-now-dead-worlds-largest-asset-manager-says-well-just-buy-whatever-central-banks
Well Alfonso, that pretty much sums it up…As we’ve been saying over and over: This is a Fed Market, not a securities market…If Blackrock’s biggest market signal (and partner) is the Federal Reserve itself, then you betchya–this is a totally rigged market, and rigged to fail our country. Why even bother with an MBA or a Series 65 or Series 7 anymore, when the only market indicator is a money-printer and interest-rate suppressor at the Eccles Building in DC. Capitalism, if I recall, is designed to punish debt-soaked companies, not bail them out or incite a classic front-run of the credit market to the benefit of 7T names like Blackrock while ordinary Americans are tossed a $1200 check and told to bite a stick. Sure COVID-19 is a horror show, but it’s not nearly as fatal as the direction our markets are now taking.