Given that there’s nothing traditional or at all normal about Fed-rigged, post-08 markets, it only makes sense to re-think traditional portfolio advice and hence traditional portfolio construction.
Traditional Portfolio Construction Worked in the Past
From my grandfather’s to my father’s generation, the historical evidence clearly supported the concept that the best way to make money in the markets was simply (and traditionally) to rely upon a carefully diversified portfolio construction and ride it out through the peaks and troughs.
Once you and your advisor had pasted together a nice, diversified “pie-chart” allocation of stocks and bonds, you were ready to make money. That was traditional portfolio construction.
For stocks, such portfolio construction involved a proper mix of large-cap, mid-cap, and small-cap names or indexes, along with a healthy mix of growth and value names in both domestic and foreign markets.
As for bonds, the smart portfolio construction contained a mix of U.S. Treasuries, corporates, municipals, and even some high-yield risk.
Typically, your advisors would then dial up the ratio of stocks to bonds – 80/20 if you were younger or more aggressive and 60/40 if you were older or more conservative.
After all, at one time, bonds were considered safer and uncorrelated to stocks.
This approach to portfolio construction was not only elegant in its simplicity, but also very effective in its long-term profitability.
Much of this effectiveness was also based on the undeniably important power of compounding returns.
As many of you have likely been told by your own advisors, an 18-year-old who puts $3,000 a year into such a portfolio would see it reach a value of $1 million by the time that smart kid turned 65 years old, regardless of bull and bear cycles.
Again, that was the combined power of traditional, diversified, passive portfolio construction and the awesome work of compounding returns.
Buy & Hold vs. Market Timing
Your advisor may have also reminded you that timing the markets was a fool’s errand.
After all, history confirmed that well before the Great Crash of 1929 to today, markets were positive more than 70% of the time.
That means, for every 20-year period, you’re likely to be up 14 of those years.
More importantly, for each 20-year period, 20 days would account for all your gains, and 20 days would account for all your losses.
Given such facts, why or how would anyone try to actively time/predict which days to be in or out?
The traditional and smart approach, alas, was to be passive and just “stay in.”
For example, from 1997 till today, there were just 50 days during that 22-year period that accounted for nearly all your gains.
Could you have possibly known which days they would be?
And had you pulled out of the markets then, you’d be 60% poorer today.
So again, the traditional answer to portfolio construction was to just stay the course – be all-in, all the time. Alas: “Buy and hold.”
Makes perfect sense, right?
Well, as we’ll soon discover below, such traditional portfolio construction makes no sense at all anymore.
First: The Facts about Market Crashes, Corrections, and Bulls
There’s all kinds of talk out there about crashes, corrections, bears, and depressions. But just what are they, and how frequently do they occur?
The facts might surprise you.
But first, let’s just stick to some simple definitions about what distinguishes a market correction from a bear market and a market crash.
In simple terms, it all comes down to peak-to-trough losses, namely as follows…
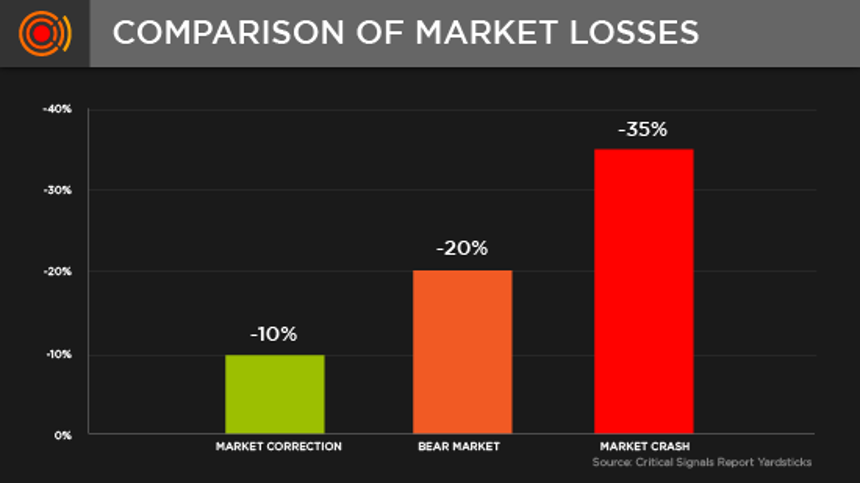
As for other key definitions, they are as follows…

Market corrections, moreover, are actually quite common.
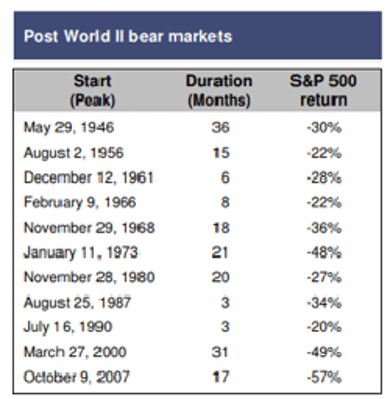
Since 1900, markets “correct” at least once every year.
As for the more alarming “bear market” history, between 1900 and 1947, bear markets occurred about once every three years, and from 1947 to 2008, once every five years.
For over a century, investors have endured a bear market at least once every three to five years and a “correction” at least once per year. Simply stated, such declines were not necessarily a rare or terrifying occurrence and thus an expected and acceptable hazard for traditional portfolio construction.
All Markets Recover – Right?
Other traditional points worth considering are the time-tested facts that most market “corrections” rebound within an average of 50 days and that most “bear markets” recover within one to two years.
Even more importantly, the past confirms that some of the most profitable trading days occur as bear markets and market corrections begin their rebound.
Again, this is why traditional thinking, as well as market history, confirm that trying to time market corrections and bears as part of an actively managed portfolio construction was just a fool’s endeavor.
Instead, the smartest, safest approach was simply to: a) expect such dark days, for they are actually fairly common, and b) ride out the storms and stay the course, for upside was just around the bend.
Again, seems pretty smart, right?
Well… not anymore. Here’s why.
2008 Markets Changed History and the Old Ways of Portfolio Construction/Management
Most of us can agree that it’s fairly natural to change with the times.
In 1910, it was not uncommon to shop for a good horse and buggy.
In 1950, it was great to have a TV that gave you three channels.
In 1980, everyone loved a good Walkman cassette player.
And by 2000, it was pretty cool to a have CD player in your car.
But times, of course, have changed.
Most of us prefer 4WD to horses and buggies or streaming movies from Hulu over a three-channel black & white TV – and our iPhone music library is a bit more fun than a cassette or CD player…
Yet as all these changes were taking place, we were still being told that the traditional pie-chart, “set-it-and-forget-it” portfolio construction of our grandfather’s generation was the only way to go, as free-market supply and demand, unlike technology, never changes.
Unfortunately, thanks to the now overwhelming role central banks play in distorting capital markets and supply and demand, we quickly discover that the old ways of portfolio construction have almost nothing to do with modern markets.
This may, of course, sound crazy. I get it.
But if you take a few minutes to review some hard facts, as set forth clearly in another report, Real Financial Advice, this craziness is indeed our new reality.
As I often say: When facts change, opinions change. And so should the rules of portfolio construction.
Today, the facts regarding market distortion compel us to rethink traditional investing advice and hence traditional portfolio construction.
Let’s Face New Facts
In 2008, for example, we saw how a central bank and a few ex-bankers sitting in D.C. effectively took a dying stock market and broken banking system out of its well-deserved suffering and bailed it out in a manner that had absolutely nothing to do with normal, “free market” forces and the laws of supply and demand.
In the old days, if a company, bank, individual, or country was greedy, over its skis in debt, and drunk with risk, markets naturally punished such behavior by taking those players out to the woodshed for a well-deserved beating.
After all, capitalism without a recession or even a crash was like Christianity without a Hell or Purgatory – you just accepted one with the other…
The New Normal – Postponing Purgatory
But in the post-2008 “new normal” of crony banking and “Wall Street Washington,” rather than punish the bad guys, we bail them out, and rather than “free markets,” we now have “centralized” markets effectively determined by central bank intervention.
Our bankers and markets went to Heaven, and Main Street went to Hell.
And how did we do this?
Simple, taxpayers forked out over $700 billion in “troubled asset relief programs” or “TARP” funds to the banks, and then the Fed printed $3.5 trillion out of thin air to effectively buy (and thus become) our bond market.
This “Fed support” artificially (rather than naturally) pushed up bond prices and thus crushed yields and interest rates to the floor.
Now, the folks in D.C. and Wall Street are very clever.
They are masters at putting lipstick on a pig and hid this otherwise grotesque destruction of free markets behind fancy terms like “quantitative easing” and “forward-guided stimulus.”
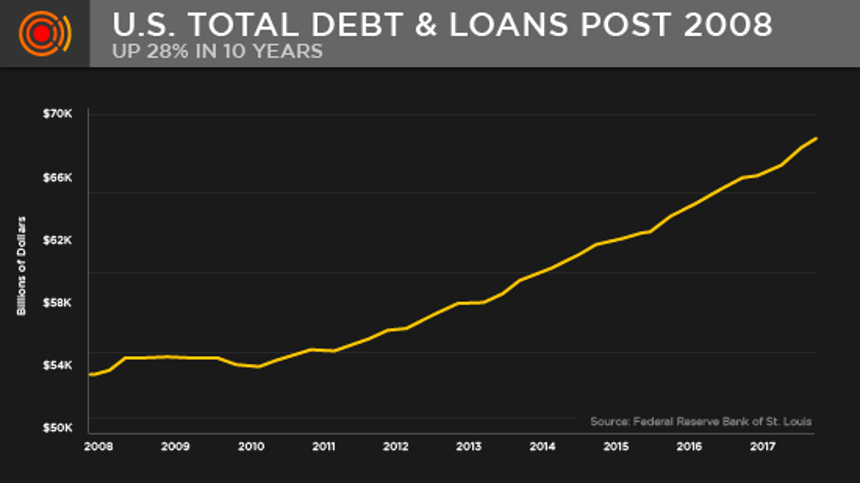
The low rate environment that such “Fed accommodation” created then lead to the biggest debt crack house in the history of the U.S., one in which individuals, companies, and our government borrowed their way into $72 trillion of combined debt that created a credit bubble that looks like this…
Which directly led to a stock market bubble that looks like this…
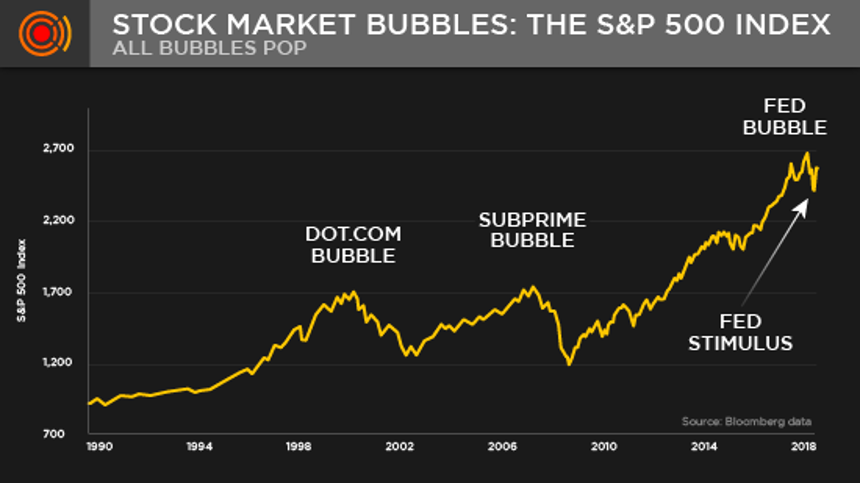
In short, after tossing trillions and trillions of dollars at the very drunk players in Wall Street who had just crushed our economy in 2008, the Fed in Washington put the rest of our economy on one big, fat Visa card.
This “bold move” dangerously inflated our entire securities market and totally erased free market forces. D.C., Wall Street, and the financial (sell-side) media then called this a “recovery.”
The Problem with Keg Parties…
But this is no recovery, it’s just a historically unprecedented market keg party thrown by a Fed that postpones a market hangover by perpetually and un-naturally handing Wall Street punch bowls of cheap debt rather than the needed black coffee of a natural bear.
Such market frat partying leads to the kind of bad behavior that any of us who drank in college can remember, including beer-goggle investing and downright dishonesty.
You just can’t make this stuff up.
Normal markets have completely left the building – or frat house…
Such drunken, debt-driven euphoria, moreover, may explain why normal bear market cycles, the kind that traditionally occur once every three to five years, have also left the scene.
As of today, we haven’t seen the bear in well over a decade.
Instead, every time Wall Street so much as sneezes, the Fed steps in with buckets of “accommodation” – i.e. more punch bowl debt and artificial rate suppression, as we just saw in March and as we’ll surely see again by year end when the bond market panics.
The Fed calls this “easing” rather than “tightening” – but hayseeds like me just call it for what it really is: faking it.
But again, in case you fear I’m exaggerating or ranting, you can see all this in far more mathematical and graphic detail in my free report, Real Financial Advice or track its sordid history in my report on How Capitalism Died.
Both fact-based reports will open your eyes and likely, well, anger you a bit…
Getting Back to Your Traditional Portfolio Construction
As we return, then, to the topic of traditional (and passive) portfolio construction, we can now likely agree that times and markets have indeed changed, right?
In other words, this ain’t Grandpa’s or dad’s market anymore.
If that’s the case, do you still think traditional market data and traditional portfolio construction approaches – which the vast majority of Americans follow – will work for you in a post-2008 market that is anything but traditional?
For example, do you still think that the traditional advice to simply be all-in and ride out the next inevitable yet Fed-postponed storm makes sense?
Don’t Trust Consensus
Certainly, most of your traditional advisors will stubbornly convince you to stay the traditional course.
After all, not only do most advisors still cling to such outdated views on portfolio construction (there’s safety in consensus), but they also get paid to keep you all in, as their fees are based on invested assets, not cash allocations…
But these are clever folks. Most of them, in fact, are good folks.
Like me, they have advisory licenses, wear nice clothes, and have a fancy diploma or two on their walls.
They really do want to believe in tradition and hence traditional portfolio construction.
I’m sure they mean well. Really, I do.
But that doesn’t make them right. In bull markets, such portfolio construction makes them look brilliant; but in bear markets, like the one we’ve postponed for over a decade, the same portfolio construction will lead to disaster.
So, next time you’re sitting with your advisor or retirement plan provider to discuss portfolio construction, and he or she reminds you to ride out the next storm because all storms traditionally pass and all markets eventually and quickly recover, let me remind you and them of a few more, well… facts.
You see, not all storms are alike.
We’re heading toward a hurricane, not a thunderstorm.
Just Look at What Happened to Japan
No two markets, countries, economies, or cultures are the same.
Nevertheless, market forces, like the laws of physics, are universal, not regional.
That is, at some point, over-indebted markets fall as naturally as Newton’s apple.
And as the Austrian economist Ludwig von Mises discovered decades ago, the bigger the debt party, the bigger the hangover that follows.
Always, every time. No exceptions. Period.
As we consider where the U.S. markets are heading, we therefore only need to consider math and history, which means we also need to consider what happened to Japan, for that was one helluva debt party…
In the 1980s, the Japanese were engaged in a record-breaking debt binge and economic expansion quite similar to our own – though ours is even worse…
At one time, it just seemed like the Rising Sun of Japan would never set, as their markets skyrocketed and their yen was buying up everything from the Rockefeller Center in NYC to coastal homes in Malibu.
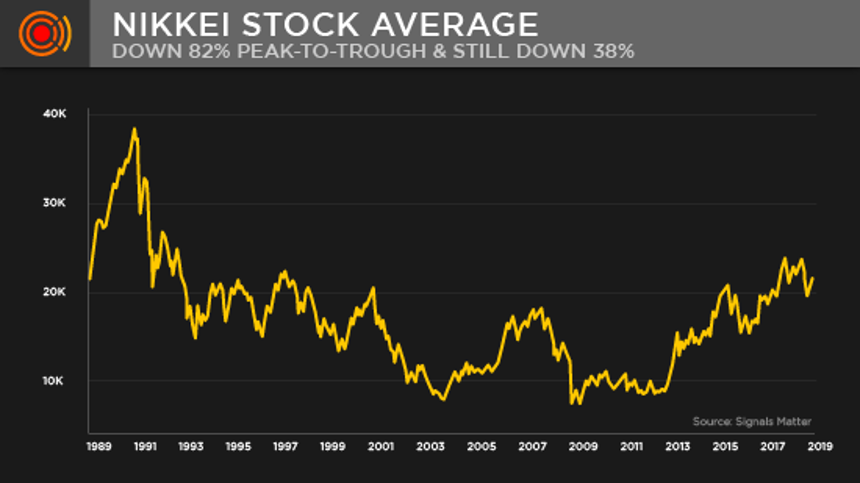
Its Nikkei then, much like our DOW, S&P, and Nasdaq today, was simply ripping up and to the right, breaking new records every quarter and peaking at 39,000 in 1989.
Safety in Numbers, Until the Whole Crowd Gets Crushed
And then, just like now in the U.S., investors were herded together like cows and bought the tops with no fear of a crash.
After all, if everyone else was buying the tops, how could you be wrong?
In fact, I remember an expression in Tokyo during that period of the Rising Sun, which basically translates to: “If everyone else is crossing the street at the same time, how can anyone get hurt?”
Again, you just can’t make this stuff up.
These were and are the kind of excuses drunk investors come up with.
But then, in 1989 the Nikkei did indeed crash under its own weight of debt, and all those investors “crossing the street at the same time” got, well… crushed at the same time.
So much for safety in numbers.
The #1 Lesson: Not Every Rebound Is a Rebound
But here’s the bigger lesson about Japan and its market disaster: Despite all the traditional rules and advice about markets quickly and typically “rebounding” after a crashing market, those rules just aren’t true anymore.
Once the debt gets too big, the pain that follows doesn’t just “recover” in the traditional one-to two-year window, even with the help of “quantitative easing” (which the Japanese in fact invented).
You see, the Nikkei crashed by 82% in 1989.
Now,30 years after that crash, the Nikkei is still 38% below its 1989 highs.
Let me repeat that:30 years and counting without a recovery!
The Key Takeaway: Don’t Assume You’ll Get a Second Chance
Please, please, please do not make the traditional assumption that riding out storms is historically confirmed to work, or that markets will quickly recoup your losses.
As Japan’s example reminds us, some debt binges and market parties are simply too decadent, too extreme, and too absurd – and thus can’t be solved with a central bank aspirin the morning after.
If you lose 50%, 60%, or even more in the next crash to hit the U.S. markets, one driven by historically unprecedented debt (falsely described as “stimulus,” “support,” or “accommodation”), you will not see it (or your losses) come back in one or two years…
Instead of the V-shaped “recovery” we saw in 2009 (driven by money printing and debt), the next L-shaped recession to hit the U.S. will last a lot, lot longer, for even our arrogant Fed can’t just print money to infinity and outlaw recessions – despite every effort to do so in the last 11 disturbing years of “free punch bowl” markets.
Riding out the storm in a set-it-and-forget-it portfolio construction model of inflated and highly correlated bonds and equally inflated stocks will not save you.
The pain ahead can last for decades, not years.
Older Investors – Be Smarter
This observation as to portfolio construction is of particular and vital importance to those of you in or near your retirement years who have been told that the next 10 years will resemble the last 10 years or that markets will eventually rise after their next fall.
Let Japan (von Mises or just physics), alas, be a reminder, as well as a warning, that market forces have more power than the forces of confidence or spin handed to you by traditional advisors following traditional consensus thinking about portfolio construction, for such thinking has conveniently forgotten the setting sun of Japan as well as the gravitational laws of debt-driven “recoveries.”
Ask yourself this: If you lose half your money at the next frat party, can you afford to wait 30 years to get it back?
The fact that so many hard-working, good Americans have been herded into such dangerous portfolio construction templates bothers me not only at an intellectual, historical, or mathematical level, but much more so – at a personal and moral level.
It is my sincere and driving aim to simply lay these plain facts of math and history before you so that you are armed with the information, perspective, math, and context to make your own decisions for your own future, and your own approach to portfolio construction.
For many of you who have been told that it’s not safe or wise to “time” a market, I get it.
Timing is hard, and more art than science.
But do you need to be a market artist or economic scientist to see that we are at least nearing a top today?
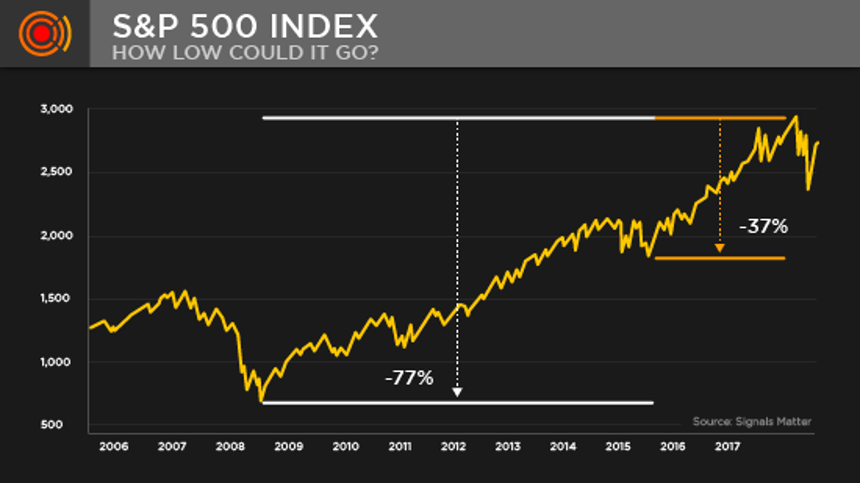
Again, just look at the S&P…Any fall from these un-natural highs, based upon pure mean-reversion, could lead to losses of 40% to 80%.
Be smart, be patient, and be careful out there.
It may be time to reconsider traditional portfolio construction, as there’s nothing traditional about a market like this.


