Good afternoon. Much to discuss today. There’s simply no way to underestimate the recession ahead.
The Fed dropped interest rates a full percentage point last evening, in panic mode.
Yet U.S. Treasury Secretary Steven Mnuchin said on Sunday’s ABC “The Week” that he doesn’t expect the Coronavirus pandemic to tip the economy into a recession ahead.
The “big boys” are ignoring market caution.
Something is at odds here. The recession ahead is now a matter of math, not opinion.
Let’s discuss.
We’re not going to beg to differ with Mr. Mnuchin. We’re not good at begging. We simply flat-out disagree.
Our last five Market Reports are pretty darn clear that there’s a recession ahead, and not just because the Coronavirus provided a tipping point. Take your pick:
Market Failure – The Fed’s Monty Python Moment
The Bear Market Returns: Who to Blame, What to DO?
Eight Market Anxiety Signals – New Risk Highs
Scary Markets and Safe Portfolios
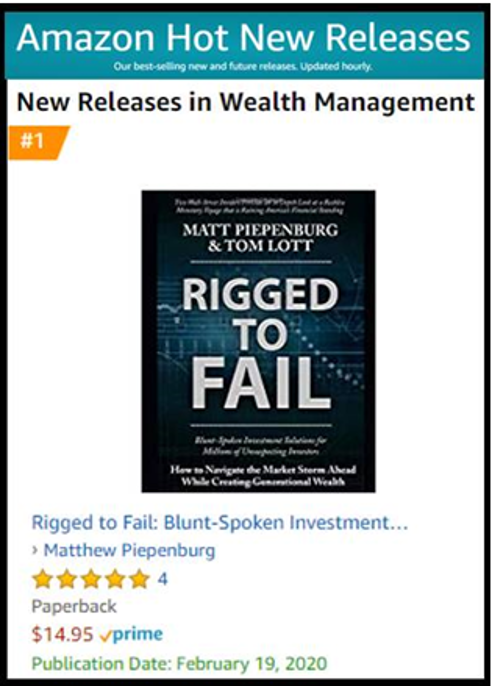
We have been slowly moving in this inevitable direction toward a recession ahead since the last Fed-driven fiasco in 2008, described in lively narrative and irrefutable and cyclical detail in our new Amazon Bestseller, Rigged to Fail on Amazon.com.
How do we know?
Because we, your Signals Matter Guides and Rigged-to-Fail authors, are veteran Wall Street insiders and we’ve seen this movie before.
Our passion has been, and remains: 1) to warn, inform and prepare Main Street investors on both the dramatic market risk which was once ahead, but now clearly at hand; and 2) to exploit the enormous opportunities that lie ahead to build generational wealth once these markets tank.
Despite the most artificial (and extended/hated) bull run in the history of modern capital markets, U.S. and global exchanges are now poised to enter an equally historic and extended recession ahead.
We’ve been calmly tracking this for quite some time, seizing opportunity along the way.
This moment of recessionary truth will significantly impact the portfolios, retirement goals and long-term plans for millions of uniformed investors.
Let’s get technical, and discuss where we are right now.
The Coming Recession
For starters, here’s the best tip we can give you right now as we venture forth, with week after week of increasing volatility: Don’t believe this chart below.
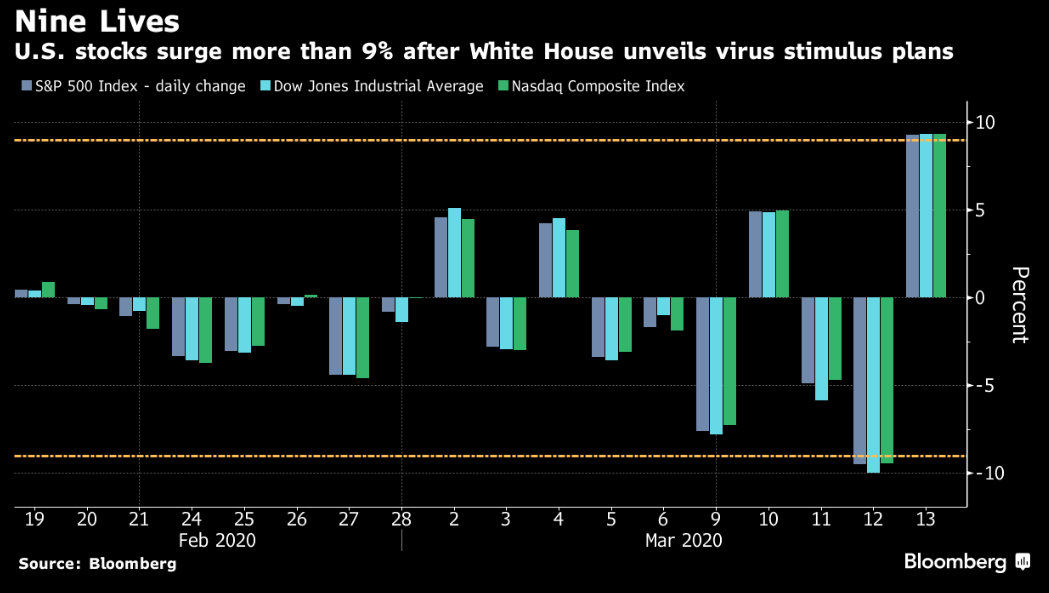
Sure, stocks surged by more than 9% after the White House unveiled its emergency declaration and virus stimulus plan last Friday.
But that was just one day last week, literally a signature day for the White House as our President, in a moment of hubris and pride over that day’s “surge”, circulated a signed copy of its benchmark performance, the S&P 500 Index. One day of “surge” after a week of tanking markets is nothing to brag about.
For this week and the weeks ahead, however, there’s less of which to be proud. Let’s take a deeper dive.
In short: Never mind all the stimulus. It’s too late. We are recession bound. In short: Recession ahead.
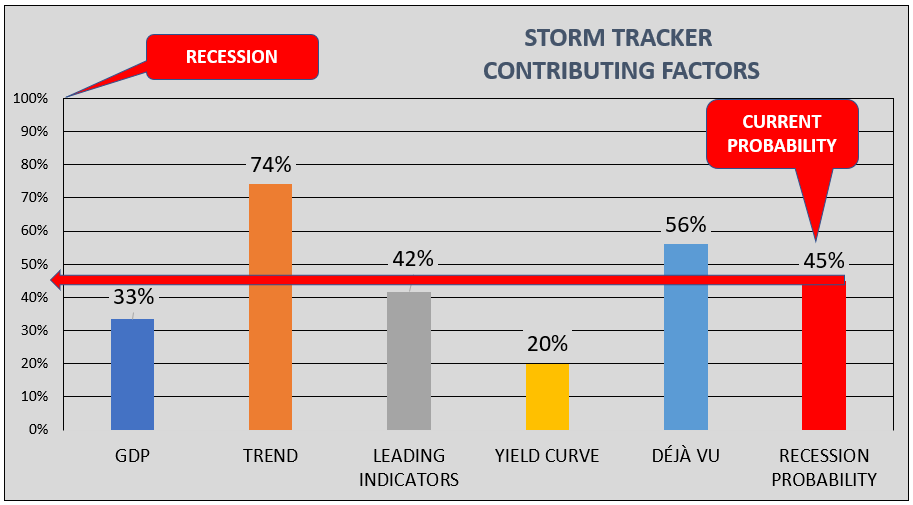
Our own Signals Matter Storm Tracker popped up last week to a 45% probability of a next recession.
Storm Tracker is an industry-leading, proprietary recession indicator that tracks changes in GDP, sector trends, leading indicators, yield curves and our own recession probability timing indicator, Déjà Vu.
To understand Storm Tracker, please run, don’t walk, and download this FREE 5-Part Series on Storm Tracker so you can start protecting your portfolio now.
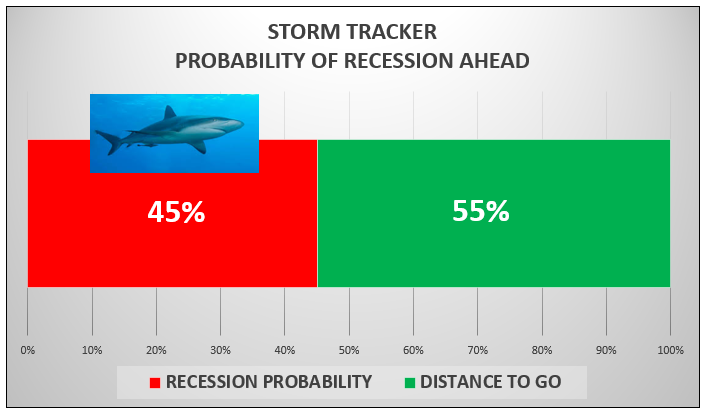
And here’s why Storm Tracker hit 45%.
The forward-looking metrics we include in Storm Tracker are on the move – up. GDP may look tame for the moment, but with the Coronavirus ramping up exponentially in the U.S. and around the world, growth is going to slow even more dramatically than tariff-driven angst.
In addition, sector Trends across financial conditions, stocks, bonds, currencies and commodities are now 74% in the red—i.e. bad.
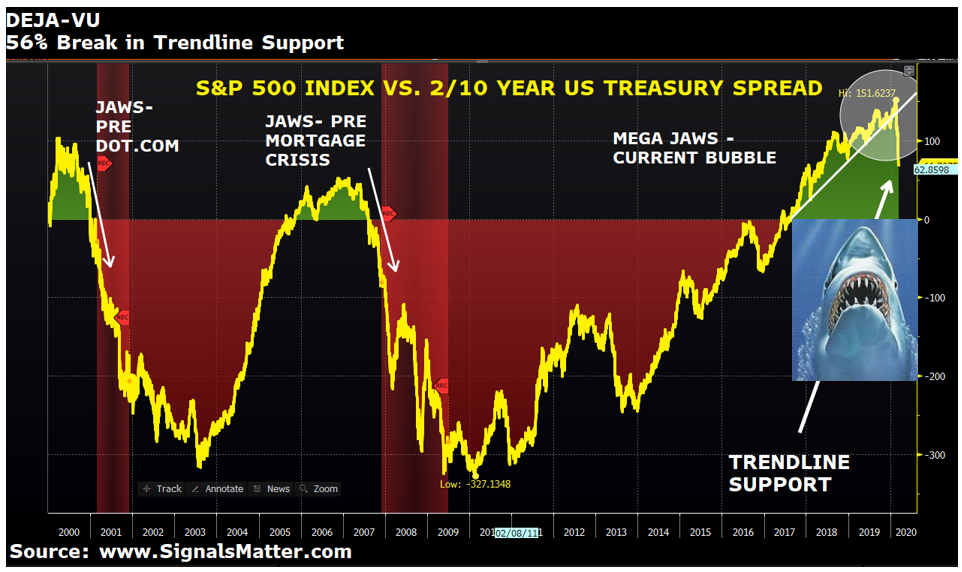
Plus, our Déjà Vu recession timing indicator doubled last week to a reading of 56% as stocks tanked and the jaw began to shut on the S&P.
Drilling down on Trends, they too have become increasingly and undeniably bad by both sector and by time frame.

Subscriber Data
Storm Tracker, supporting data and our narrative on what all of this means for you and your portfolio are all deliverables that we update daily for our Signals Matter Subscribers.
Occasionally, however, we pull back the firewall and share bits and pieces of our content with non-subscribers, as today, because you need to know as the recession ahead hits landfall.
But if you’d like to be in-the-know constantly on what’s driving risk, what precise portfolio suggestions we have for you, right now and each week as these markets gyrate toward the recession ahead, Subscribe Right Now.
Yes, the markets have already taken a hit, but it’s never too late to shore up your portfolio.
We’re holding subscriptions to a promotional rate of $195 annually for now, for information that is as valuable as it is honest, information your advisor is not so bluntly sharing.
Prices will be rising, so we encourage you to act now on what amounts to 53 cents/day!
Sobering Data
Don’t believe us when it comes to the recession ahead?
Ok, then let’s put our data aside for a moment and simply walk through what others are saying and what the public charts (i.e. facts) are telling us.
By example, Bloomberg’s own recession-probability indicator, based more narrowly on signals generated from the U.S. yield curve, shifted last week to show a better than 50% chance of an economic slump within the next 12 months.
With bonds recently far outperforming stocks, Bloomberg says it’s “clear that the markets now are positioned for a recession in the U.S. this year.”

The European Community is expecting a recession as well, nod to the Coronavirus which is shutting down the continent, saying there could be a 1% contraction this year.
That would be the deepest in Europe in more than a decade, more severe than the downturn experienced during the sovereign debt crisis.

The U.S. Fed dropped interest rates a full one percentage-point last evening, in a panic mode that has riled rather than calmed the markets, with U.S. equity futures opening limit down today, tripping market circuit breakers as treasury yields plunged all across the curve.
Still believe that the Coronavirus pandemic won’t tip the economy into the recession ahead?
Come on. That’s clearly not what the Fed is thinking. They too are in a full panic, as seen by the rate cut on Sunday, the money printing today and the tanking S&P. Like Custer at Little Big Horn, the Fed is running out of bullets and in full panic mode.
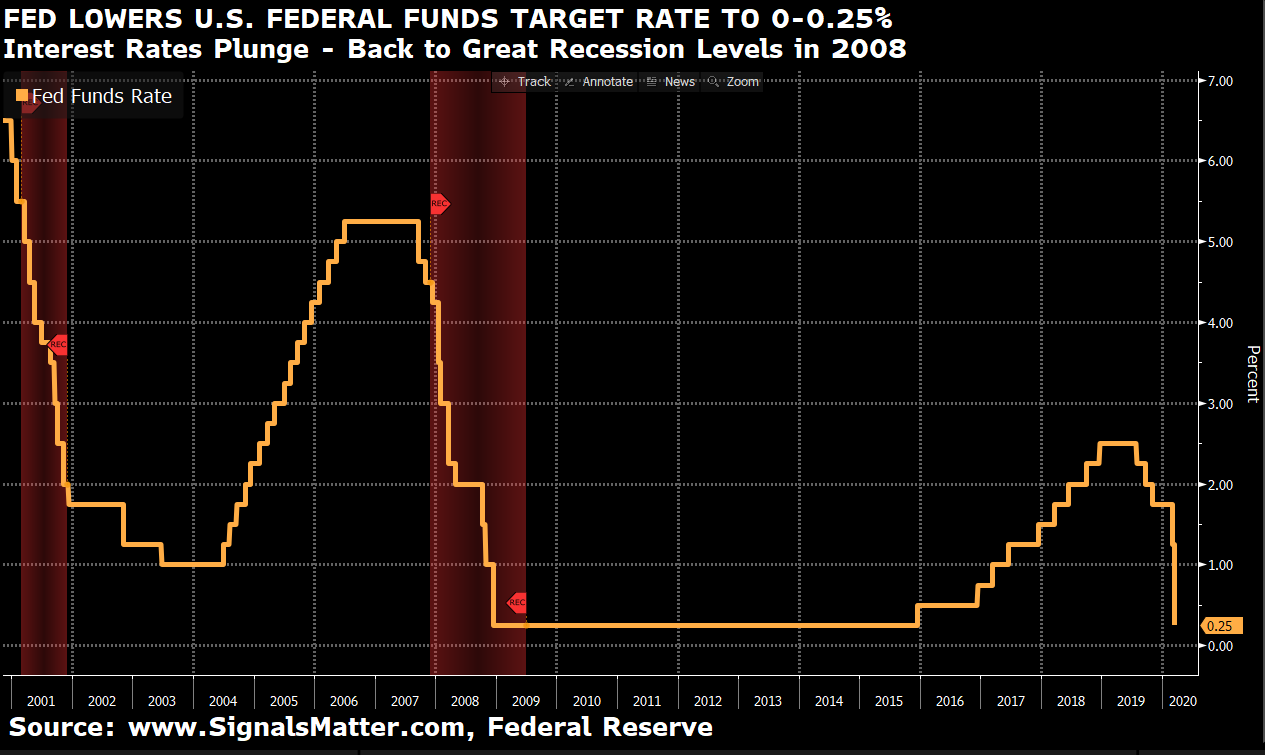
In addition to slashing rates, the Fed has been adding over 4 trillion of combined new stimulus. $1.5 trillion of additional repo market liquidity via daily, bi-weekly and monthly loans, billions more per month in direct open market T-Bill purchases, and now, as of Sunday, over $700 billion in direct Treasury Bond purchases—i.e. “QE on steroids.”
This is irrefutable evidence of a recession ahead and recession fears at the Fed.
In this low rate warning bell, investors are running to safe havens, but, like Custer…there’s nowhere to hide.
Is Safe-Haven Investing Really Safe?
That’s a really good question, for when safe-haven investing starts to lag, that means nothing is working, that investors are cashing in.
Lately, we’re seeing signals that, indeed, safe-haven investing may be a thing of the past. We warned long ago that traditional asset classes and traditional portfolios just won’t work as they did before.
When markets really sell off, they REALLY sell off, not just the risky stuff, the safe stuff too.
Take bonds, for example.
Who said stocks and bonds can’t fall together?
They can and they have this March. Stocks and bonds make up 80% of traditional advisor-driven portfolios.
That’s been great in the bull run since the 2009, with the Fed pinning interest rates to floor, enabling stocks and bonds to rise together in a falling interest rate environment.
But as we warned, when the bear enters, the traditional portfolio of stocks and bonds no longer “hedge” each other, they simply tank together as longer-term bonds are falling now, along with stocks, as fear builds with each day the recession ahead gets closer to land.

Take utilities, for example.
U.S. utility stocks are a classic go-to safe haven when risks rise.
No longer. Utilities posted their biggest weekly loss in more than 11 years last week, showing that even traditional safe havens aren’t immune to this virus-induced sell-off, falling 14% in the last 5-days, exceeding the 11% selloff in the S&P 500 Index. That’s a bad sign. Very bad.

Take gold, as another example.
Gold’s status as a haven in times of crisis is well known. But gold took a hit last week as well.
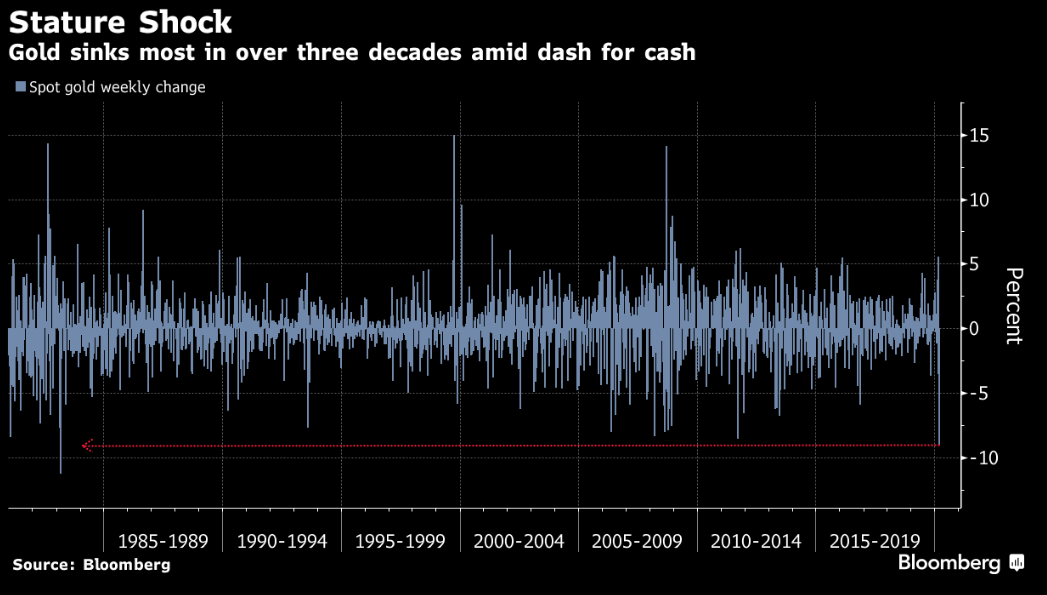
Why? Because equities were in a meltdown, forcing investors to sell the metal to raise cash and cover losses in other markets.
Subscribers, however, already know our views on gold. This deflationary pull-back in gold was anticipated here and here and our reasons for holding onto it was made equally clear in both reports.
Take other Commodities, for example.
Commodities generally do well in recessions as an alternative, and less correlated asset to stocks and bonds.
Yet Bloomberg reminds us, yet again, that everything has changed thanks to years of Fed distortion of asset classes and rising political tensions overseas.
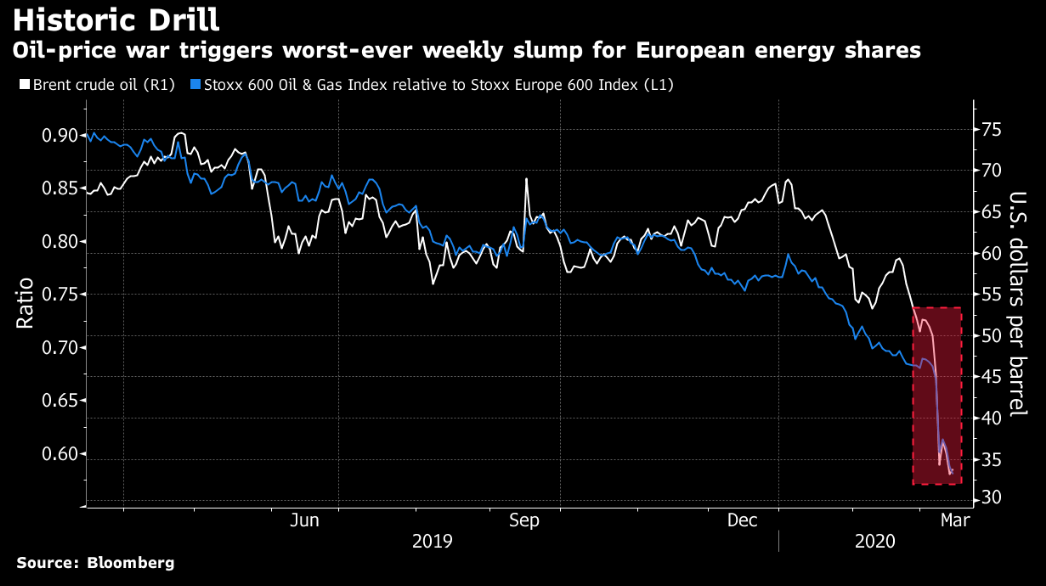
Global oil benchmarks in London and New York wiped out more than a quarter of their value in the first minutes of Asian trade Monday after OPEC+ talks failed to reach a deal and Saudi Arabia slashed the price of its crude.
Energy shares in Europe plunged, capping their biggest weekly drop on record. No safety there.
Yield Curves | Behind the Scenes
Now, some of you may be taking comfort in this chart below. The U.S. Treasury yield curve is no longer inverted. Have a look at the curve last week.
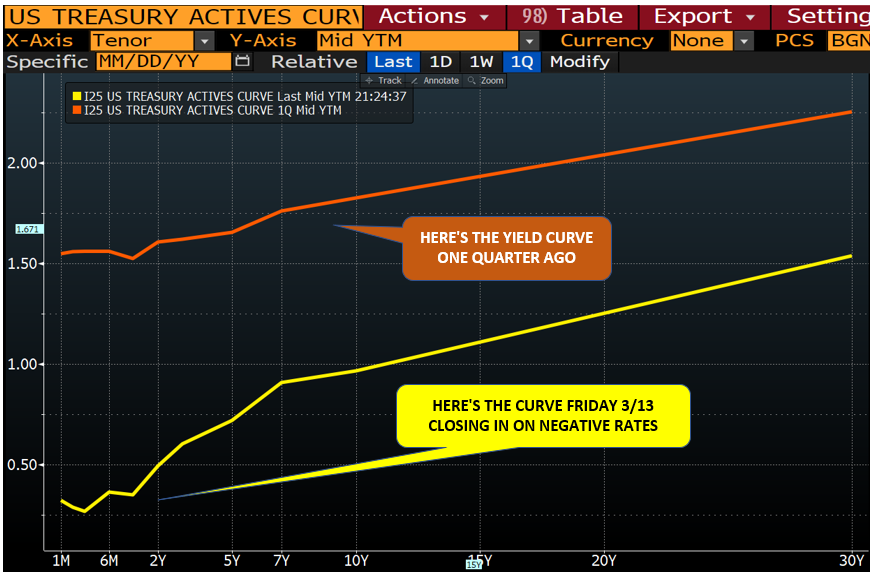
Here’s the rub. This yield curve is not really real.
Huh?
That’s right. The reason the yield curve straightened out is not because all is good as we return to a goldilocks era.
Consider first the short end of the curve above, where rates have fallen from 1.50% one-quarter ago to 0.25% last week.
Why? The Fed lowered the Fed Funds Rate last week by 50 basis points to stimulate a coronavirus-infected economy. And last week, the Fed flooded the short-term/repos markets with massive amounts ($1.5 trillion!) of liquidity.
On Sunday, the Fed lowered rates yet again, by an entire 100 basis points. We’ll soon be in negative interest rate territory. In fact, we already are, inflation adjusted.
Hello Europe. Hello Japan. Goodbye America. We really don’t want to join the Negative Interest Rate Club, but here we go, grasping for straws as the recession ahead races toward us.
Now let’s look at the long end of the curve. Last week was a horrible week in the markets, right?
When horrible gets really horrible, investors sell everything from gold to, yes, even safe haven bets in bonds, utilities, and other commodities, as we discussed above.
When that happens in the bond market, as it did last week, price falls and interest rates rise.
As Matt has warned hundreds of times, rising rates are the shark fins which kill debt-soaked markets.
Lower rates on the short end of the yield curve, coupled with higher rates on the long end, have restored a positive-sloping yield curve, but for the wrong reasons – (1) fear by the Fed on the short end and (2) fear by investors on the long end.
Meanwhile, however, the debt is still out there, and so is that circling shark of rising yields. Recession ahead folks…
Recessions Are Cyclical
Recessions are cyclical. They just are. We’re overdue, never mind the Coronavirus.
And they have historically been preceded by extreme highs in equities and extremely flat or inverted yield curves, which is where we have been. The warning signs have been there, and we’ve been pointing them out for months.
We also track the enormously important spread between equities and yields to inform on the speed and timing of the recession ahead, a model we call “Déjà Vu”, French for “we’ve seen this movie before.”
Here’s what Déjà Vu looked like at the end of last week. Drumroll the “Jaws” theme song…
Let me explain. It’s not that hard.
Those vertical red columns above illustrate prior recessions, namely following the 2000 dot.com bubble and the 2008 mortgage crisis.
The Déjà Vu spread is the gyrating yellow line in the chart. The white line (upper right) displays recent support for the spread dating back to early 2018, and the green colored areas represent the size and danger of the spread in prior recessions as well as the current recession-ahead moment.
The last recession was a long time ago. The current spread (Green, far right) is really high compared to prior recessions, right?
That means that in the recession ahead, the “bite” or fall will be tougher on traditional portfolios, and faster. Makes sense.
Well, now this trusted white trendline has been seriously violated by the falling yellow line, with the spread now tumbling over halfway towards the jaws of recession. A continuing fall from here would indeed be ominous.
If you’d like to follow Déjà Vu, and its impact on Storm Tracker, you can Sign Up Here. To honor our Subscribers, we simply cannot report this number with frequency in the public domain.
Bottom Line: Global Wealth is Getting Destroyed. Recession Ahead
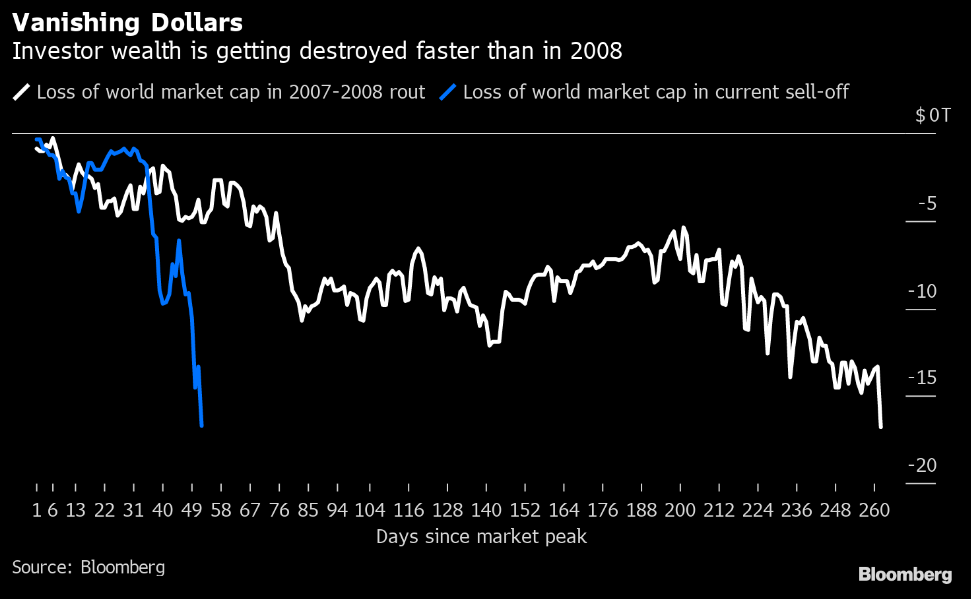
World wealth is often measured/benchmarked by world market capitalization. Bloomberg reports that almost $17 trillion has been erased from equity values since January 20 as the coronavirus pandemic throttles an already-debt-wracked world economy.
The Bloomberg chart below shows that Global market capitalization has fallen to $72.5 trillion through Thursday, the lowest level in 14 months, with the pace of wealth destruction now moving faster than in 2007-2008. Hence the Fed panic on Sunday.
Here at home, the S&P 500 Index is widely regarded as the best single gauge of large-cap U.S. equities and serves as the foundation for a wide range of investment products.
The index includes 500 leading companies and captures approximately 80% coverage of available market capitalization.
Per the chart below, the market capitalization of the S&P 500 Index, peak-to-valley in the last 22 days, tumbled $7.8 trillion (27%) from $29.2 trillion to 21.4 trillion.
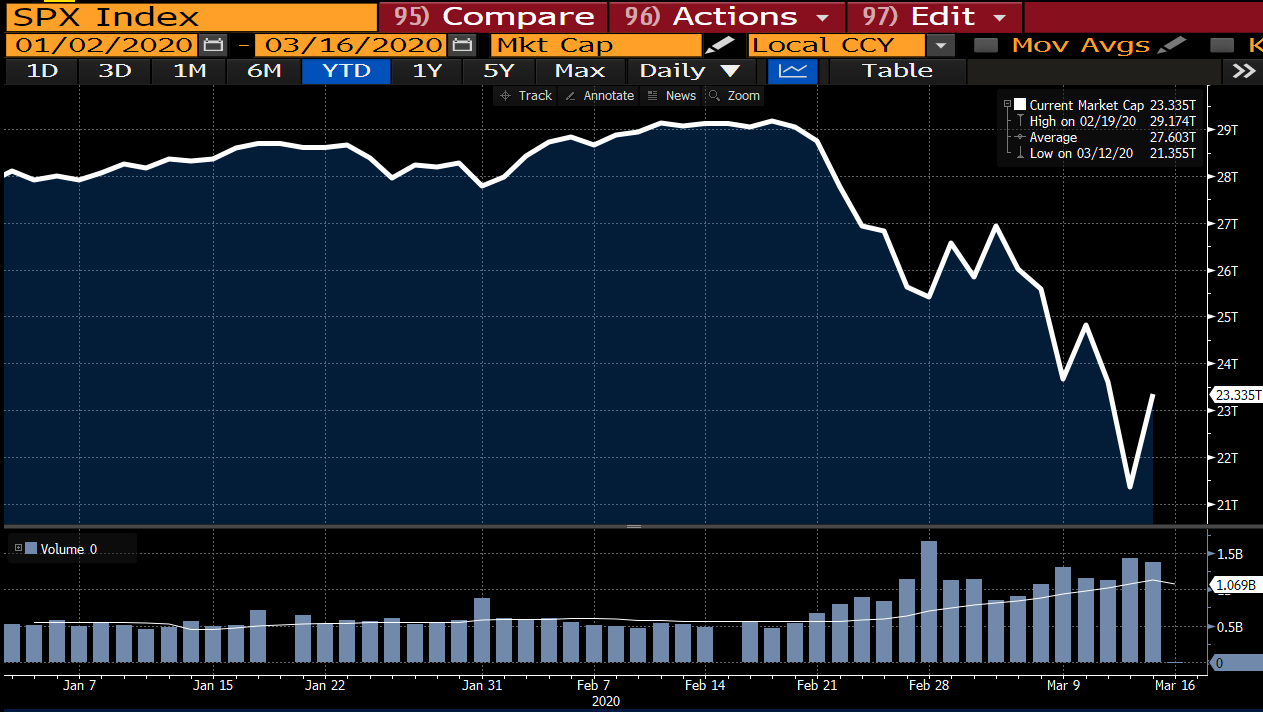
That’s a bunch and in very few days. No recession in sight? Nah. Recession ahead folks.
Let’s talk about what to do.
What’s an Optimal Portfolio Right Now? Proof in the Performance.
Great question. That’s what I do here at Signals Matter. After years of operating hedge funds as a CFTC-registered Commodity Trading Advisor & Commodity Pool Operator, I’ve been around the block when it comes to building risk-contained portfolios.
As of today, Monday at 10am, our Signals Matter portfolio suggestions (that have included 35-45% cash) are up +5.44% from mid-December (and up +9.55% if fully invested, assuming you have that 45% cash stashed elsewhere – that’s important).
Signals Matter’s positive performance is compared to the negative -23.17% for the S&P 500 Index. That’s a positive 29-percentage point spread over the S&P 500 in three months (or a 33-percentage point spread if fully invested).
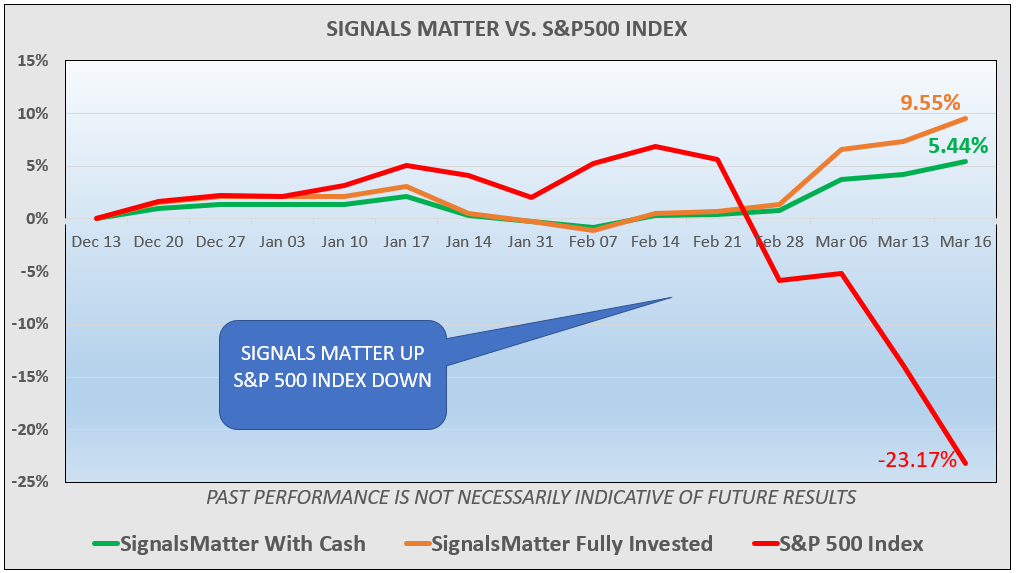
In short: It pays to be informed and contrarian, rather than uninformed and herd-following.
I’ll close by sharing this. I’m beginning to feel the same way now as I did on 2008 when my hedge fund was crushing the S&P 500 Index. I’ve been there.
I know what’s in store for traditional investors this time around. I know what it means when safe haven investing stops making money. It’s means there’s probably a huge margin call in the offing.
A sell-everything kind of mentality to raise cash to cover debt binges doesn’t bode well, especially for investors that just aren’t getting the advice they need.
Come Join Us, for Pete’s Sake
So, Come Join Matt & Me behind the Subscriber Portal at www.SignalsMatter.com so we can update you daily and weekly (not like this in a one-off Market Report) on GDP, trend, leading indicators, yield curves, Déjà Vu, Storm Tracker and Portfolio Suggestions that will keep you safe AND give you every question you will need to pin down your current Financial Advisor.
Hey, I was a Financial Advisor and Portfolio Manager at Morgan Stanley. I get it, what they do well and what they do not do so well.
Lastly, David G., you made my day with your posted comment to The Bear Market Returns: Who to Blame, What to Do? You said,
“Your info and suggestions are very impressive. I am so blessed to have joined. Following your suggestions has saved me a ton of money. Stay well my friends.”
That’s exactly why Matt and I are here. To save you money and to keep YOU well safe. We do this for ourselves, same as you.
Until next time, be well, stay informed, stay safe and Subscribe so we can keep you in the know.
Sincerely,
Tom Lott
Signals Matter Portfolio Strategist

