Below, we look at the critical importance of the Sortino Ratio.
The Sortino Ratio
Several of our Subscribers recently asked to understand the Sortino Ratio better when it comes to investing – what is it, why is it helpful, and what’s wrong with the Sharpe Ratio?
No, the Sortino is not a quaint coastal village along Italy’s Amalfi Drive or a province in Sicily. But when used properly, it will help you get there.
Here’s what the Sortino Ratio is. It’s a time-tested performance metric for constructing investment portfolios – basically an improved variation of the more well-known Sharpe Ratio. Both ratios assess a portfolio’s performance relative to the overall risk. Both measure the chance that your actual gains will differ from what you expected, yet there is a crucial difference between the two.
Defining Risk
Before we discuss how to qualify investment risk, let’s define it. Risk isn’t just about losing money; it’s about uncertainty, the rollercoaster ride of market ups and downs, which we call standard deviation.
In portfolio management, standard deviation quantifies how much zigging and zagging is within your portfolio. Portfolios with low standard deviation don’t move a whole lot over time. Portfolios with high standard deviation zig-zag a whole lot more. Pick your poison, but the difference matters.
Savvy investors use standard deviation to gauge how volatile (risky) their portfolio is. The greater the risk, the higher (or lower) potential return. There’s always a tradeoff.
Take US bonds – low risk, low return. Take corporate bonds – higher risk than US-backed bonds. Take the stock market – yikes! Take your portfolio – that’s up to you, your penchant for risk, your ability to take on risk, your lifestyle, age, and other factors.
Quantifying Risk
Sharpe and Sortino Ratios come into play in portfolio construction as they measure the standard deviation of return streams. The standard deviation of a portfolio and its components defines whether it is a calm or wild ride compared to historical averages. Low standard deviation—relax. High standard deviation? Buckle up—it could be a wild ride!
Specifically, the Sharpe Ratio measures overall portfolio risk, while the Sortino Ratio measures downside risk ONLY. That’s a big difference, and it renders the Sortino Ratio particularly useful for evaluating investments and building portfolios where minimizing losses matters.
Unlike standard deviation (which considers all deviations from the mean, up or down), downside deviation only looks at negative deviations, which is all we care about – not losing. The higher the Sortino Ratio, the better the risk-adjusted return.
The Sortino Ratio measures a portfolio’s risk-adjusted return, penalizing only returns falling below a user-specified target or required rate of return. The Sharpe Ratio penalizes both upside and downside volatility equally, which brings us to the punch line.
By Example
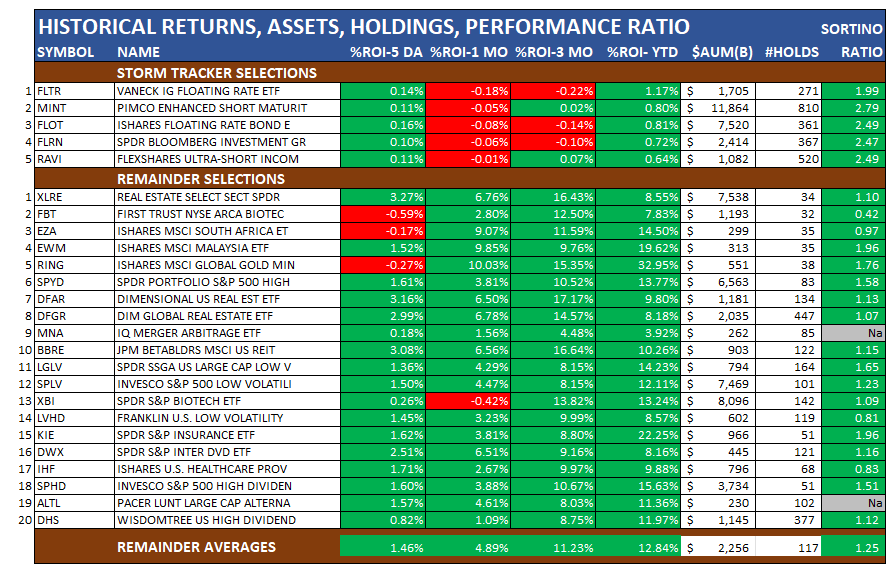
Take a look at these tickers. The Sortino Ratio appears in the right-hand column – all positive and mostly greater than 1. Past performance is not indicative of future results – for illustration purposes only.
Bottom Line: Why Penalize Upside Volatility?
It seems so simple. Why use a performance measure like the Sharpe Ratio that penalizes upside volatility? We solve FOR upside volatility—all we can get. We solve for it in our portfolio construction process to contain downside and portfolio-level volatility.
Though both ratios measure an investment’s risk-adjusted return, they do so in significantly different ways, which may frequently lead to differing conclusions about a portfolio’s true return-generating efficiency. Just a heads up – traditional money managers (Wall Street) tend to measure performances with the wrong ratio (the Sharpe Ratio), and they do so passively, not actively to achieve a better result.
An Artful Science
Managing risk is both an art and a science—we call it an artful science. Diversify wisely, measure what you’re adding to a portfolio BEFORE you add it, not afterward, and use tools like the Sortino Ratio to enable informed decision-making. Art is intuitive, subjective, and fueled by imagination. Science is research, measured, and objective.
So, the next time you build a portfolio from scratch or analyze what you have, use an artful science. That way, you can jigger the math to 1+1=3, portfolio returns higher than the sum of its parts. You’ll have earned your ride to the Amalfi Drive.
If you want to learn more about our portfolio-building process and observe our trading activities, we invite you to join us at www.SignalsMatter.com. Alternatively, you can invest in our hedge fund at www.SignalsMatterAdvsiors.com and let us take the wheel. If you have any questions, feel free to book a meeting with us.
Even More
Signals Matter Market Reports reflect the company’s long-term macro views and are posted free of charge at www.SignalsMatter.com, on LinkedIn, and directly to your inbox by Signing Up Here. Portfolio Solutions are geared to shorter timeframes and may differ from our longer-term perspectives. Our actively managed Portfolios are available to Subscribers who Join Here and to Accredited Investors who directly invest in Signals Matter Partners, LP. For further information, click Direct Invest or Book a Meeting with us.